Free Writing Prospectus dated February 28, 2018
Relating to Preliminary Prospectus dated January 8, 2018
Filed Pursuant to Rule 433 under the Securities Act of 1933
Registration Statement No. 333-222475
Altice USA, Inc.
This free writing prospectus relates only to, and should be read together with, the preliminary prospectus dated January 8, 2018 (the “Preliminary Prospectus”) included in the Registration Statement on Form S-1 (File No. 333-222475) (the “Registration Statement”) relating to the distribution by Altice N.V., the controlling stockholder of Altice USA, Inc. (the “Company”), of the Company’s Class A common stock and Class B common stock to Altice N.V. shareholders, which may accessed through the following link:
https://www.sec.gov/Archives/edgar/data/1702780/000104746918000085/a2234168zs-1.htm
This free writing prospectus should be read together with the Preliminary Prospectus included in the Registration Statement, including the section entitled “Risk Factors” beginning on page 17 of the Preliminary Prospectus.
* * *
|
|
Earnings Release |
February 27, 2018
ALTICE USA REPORTS FULL YEAR AND FOURTH QUARTER 2017 RESULTS
Delivers Another Year of Revenue Growth and High Cash Flow Growth
Further Progress Against Key Company Initiatives
Remains on Track for Anticipated Spin-Off from Altice N.V.
Altice USA (NYSE: ATUS) today reported results for the full year and quarter ended December 31, 2017(1)
Dexter Goei, Altice USA Chairman and Chief Executive Officer, said: “2017 was a transformational year for Altice USA. We continued to have great momentum and delivered strong financial results by growing our customer base, revenues and margins with high free cash flow growth. We have made significant investments in our customer experience as well as strategic decisions to improve our products and services. This includes expanding the availability of ultra-fast broadband speeds, launching our new integrated entertainment platform Altice One, expanding our content line-up, commencing the rollout of a state-of-the-art fiber (FTTH) network, signing a full MVNO agreement to be able to launch mobile services for our customers and investing in a multiscreen addressable and national advertising platform. In 2018 and beyond, we will remain very focused on investing for growth in innovation, superior service and an advanced network to deliver a more robust and differentiated product portfolio to meet customers’ needs.”
Altice USA Key Financial Highlights
· Revenue growth of +3.2% YoY in FY 2017 (excluding Newsday); reported revenue growth of +1.9% YoY to $9.33 billion
· In Q4, reported revenue grew +2.6% YoY to $2.37 billion, driven by residential (B2C) revenue growth of 1.8%, business services (B2B) revenue growth of 5.1% and advertising revenue growth of 9.9%
· Adjusted EBITDA grew +19.5% YoY in FY 2017 to $4.01 billion; Adjusted EBITDA (excluding Newsday) margin increased 5.9 percentage points YoY to 42.9% (44.1% in Q4 2017)
· Operating Free Cash Flow(2) grew +25.8% YoY in FY 2017 to $3.01 billion with an OpFCF margin of 32.3% vs. 26.5% in FY 2016 (OpFCF margin of 34.5% in Q4 2017) showing very strong cash flow conversion
|
|
|
Three Months Ended December 31, |
|
Twelve Months Ended December 31, |
|
|
|
|
2017 |
|
2016 |
|
2017 |
|
2016 |
|
|
($k) |
|
Actual |
|
Actual |
|
Actual |
|
Actual |
|
|
|
|
|
|
|
|
|
|
|
|
|
Revenue |
|
2,365,378 |
|
2,305,901 |
|
9,326,570 |
|
6,017,212 |
|
|
Adjusted EBITDA(3) |
|
1,043,337 |
|
929,608 |
|
4,005,690 |
|
2,414,735 |
|
|
Net income (loss)(4) |
|
2,254,682 |
|
(236,049 |
) |
1,521,618 |
|
(831,479 |
) |
|
Capital Expenditures (cash) |
|
228,066 |
|
247,815 |
|
991,364 |
|
625,541 |
|
(1) Financial data for twelve months ended December 31, 2016 is pro forma defined as results of Altice USA as if the Cablevision (Optimum) acquisition had occurred on January 1, 2016, unless noted otherwise. All financials shown under U.S. generally accepted accounting principles (“GAAP”) reporting standard.
(2) Operating Free Cash Flow defined here as Adjusted EBITDA less cash capital expenditures.
(3) See “Reconciliation of net income (loss) to Adjusted EBITDA and Adjusted EBITDA less Cash Capital Expenditures” on page 9 of this release.
(4) Pursuant to the enactment of the Tax Cuts & Jobs Act (“Tax Reform”) on December 22, 2017, the Company recorded a noncash deferred tax benefit of $2,337,900 in Q4 2017 to remeasure the net deferred tax liability to adjust for the reduction in the corporate federal income tax rate from 35% to 21% which is effective on January 1, 2018.
1
Altice USA Operational Highlights
· Residential (B2C) revenue growth of +2.9% in FY 2017 driven by growth in total unique residential (B2C) customer relationships with net additions of +7k in FY 2017 (+6k in Q4 2017)
· Residential (B2C) ARPU increased 2.2% YoY to $139.8 in FY 2017 (+1.5% YoY in Q4 2017 to $140.2)
· Residential (B2C) broadband net additions of +25k, pay TV RGU net losses of -25k, and telephony net additions of +10k in Q4 2017 (vs. +36k, -21k, and -4k in Q4 2016 respectively)
· Solid Business Services (B2B) revenue growth of +5.5% in FY 2017 driven by superior SMB growth +7.5% YoY with SMB representing c.64% of total B2B revenue (Enterprise & Carrier revenue, representing c.36% of total B2B revenue, grew +2.3% in FY 2017)
· Advertising growth supported by investment in multiscreen and national targeted audience capabilities
· Continued enhancement of data services with an increased demand for higher speed tiers; 90% of B2C broadband gross additions taking download speeds of 100Mbps or higher at end of Q4
· Up to 400Mbps broadband speeds were available for 86% of Altice USA residential/business customers by the end of 2017, including 95% of the Optimum footprint, with 72% of the Suddenlink footprint now able to receive up to 1 Gigabit speeds
Altice USA 2018 and Medium-Term Financial Outlook
For the full year 2018 Altice USA expects:
· Revenue growth c.2.5-3.0% YoY
· To increase investment for the continued rollout of Altice One, fiber (FTTH) deployment, and new MVNO network investment keeping with annual capex ~$1.3bn
Altice USA also reiterates its plan to expand its Adjusted EBITDA and cash flow margins over the medium- to long-term.
Additional Q4 2017 Highlights
Product and Service Enhancements and Innovations
The Altice One service, the company’s connectivity and entertainment platform, became available across the full Optimum footprint in January 2018 with integrated access to Netflix. Altice One combines the latest video, internet and connectivity technologies into one immersive experience as we make it simpler for our customers to find video content they want to watch and access their on-demand subscriptions such as Netflix in one place. The commercial launch of Altice One is expected across the Suddenlink footprint during the second and third quarters of 2018.
In November 2017, Altice USA opened its first customer experience center at the Westfield Garden State Plaza Mall in Paramus, New Jersey and in February opened its second location at the Westfield South Shore Mall in Bay Shore, NY. These next-generation retail stores provide consumers an opportunity to interact firsthand with the Company’s Optimum-branded digital cable television, high-speed Internet, WiFi and voice services, as well as purchase third-party merchandise. The Optimum Experience Centers are changing the way we interact with our customers and the way they interact with us by providing a more personal, in-store experience that showcases the many ways we enable seamless connectivity.
2
Altice USA also unveiled an enhanced portfolio of international TV packages to provide customers with even more high-quality and in-language programming options to meet their content needs. These include Spanish, French and Russian-language TV packages for Optimum and Suddenlink customers.
Partnerships
On November 5, 2017, Altice USA and Sprint announced a new multi-year strategic agreement under which Altice USA will utilize Sprint’s network to provide mobile voice and data services to its customers throughout the nation. In this agreement, the first of its kind, Sprint will provide Altice USA with access to its full MVNO model, allowing Altice USA to connect its network to the Sprint Nationwide network and have control over the Altice USA mobile features, functionality, and customer experience. We are moving forward with our plans with Sprint, developing the core network in 2018, and expect to commercially launch a mobile service for Altice USA customers by 2019.
i24NEWS, which launched in the U.S. in February 2017, expanded its carriage relationships in the fourth quarter with the launch of the network on Charter Communications. i24NEWS is now available on Altice USA’s Optimum and Suddenlink systems, Mediacom systems (launched in Q3) and Charter’s Spectrum systems. With global headquarters in Tel Aviv, European headquarters in Paris, and U.S. headquarters in New York City, i24NEWS is the only 24/7 international news and current affairs channel broadcasting from the heart of the Middle East. It is available in millions of households worldwide, and offers live news reports daily to viewers, providing a unique and connected international news organization in the marketplace.
On December 13, 2017 Altice USA, Charter Communications and Comcast Cable announced a preliminary agreement to form a new Interconnect in the New York market that will provide a one-stop advertising solution to reach more than 6.2 million households across the New York DMA. For marketers, agencies and advertisers, the new Interconnect will provide an enhanced way to strategically reach audiences across TV and digital platforms.
Network Investments to Enhance Broadband Speeds and Reliability
Altice USA’s fiber-to-the-home (FTTH) deployment continues to progress well with construction to connect several hundred thousand homes in New York, New Jersey and Connecticut underway. The fiber network build is expected to accelerate in 2018 with the first commercialization of FTTH services later this year. Altice USA’s FTTH network will benefit customers by enabling for a more connected home, and by delivering faster speeds and a high-quality service experience.
Altice USA also continues to roll out enhanced data services to its customers on its existing hybrid fiber coax (DOCSIS) cable network and an increasing number of consumers are selecting increased broadband speeds:
· Up to 400Mbps broadband speeds were available for 86% of Altice USA residential/business customers by the end of 2017 including 95% of the Optimum footprint (increased significantly from a maximum speed for Optimum customers of 101Mbps when Altice took over the business);
· Altice USA continues to see an increasing number of customers upgrading their speed tiers with 90% of residential broadband gross additions taking download speed tiers of 100Mbps or higher at the end of Q4 2017 (61% of the residential customer base now take speeds of 100Mbps or higher, increased from just 21% at the end of Q4 2016);
· Up to 1 Gigabit speeds were available for 29% of Altice USA’s customers by the end of 2017, representing 72% of the Suddenlink footprint where the Company continues to expand the availability of this service (increased from c.40% prior to the Suddenlink acquisition);
· These upgrades have allowed us to meet customer demand for higher broadband speeds with the average broadband speed taken by Altice USA’s customer base more than doubling to 128Mbps at the end of Q4 2017 (from 64Mbps at the end of Q4 2016) with average data usage per customer
3
reaching over 200GB as of the end of 2017 as customers are using our broadband services more and more.
Programming
Altice USA is focused on providing the highest quality video and service experience to our customers at a great value, and these arrangements ensure that Altice USA’s customers will continue to receive the programming they want at a competitive cost.
Most recently on February 13, 2018, Altice USA and Starz announced a new multi-year affiliation agreement, securing rights for Altice USA to offer the full suite of STARZ and STARZ ENCORE premium linear and HD channels, On-Demand, HD On-Demand and online services across the Optimum and Suddenlink cable systems. The agreement also allows for Altice USA to sell the STARZ App to their customers on the new Altice One entertainment service, as well as broader digital rights including TV Everywhere.
This agreement with Starz follows the recent comprehensive distribution agreement to deliver Disney’s lineup of sports, news and entertainment content to Optimum video customers across television and streaming devices reached on October 5, 2017.
Altice USA Spin-Off
On January 8, 2018 Altice N.V. (“Altice NV”, Euronext: ATC, ATCB), the majority shareholder of Altice USA, announced that its Board of Directors had approved plans for the separation of Altice USA from Altice NV (which will be renamed “Altice Europe”). The separation will enable each business to focus more on the distinct opportunities for value creation in their respective markets and ensure greater transparency for investors. The proposed transaction is designed to create simplified, independent and more focused US and European operations to the benefit of their respective customers, employees, investors and other stakeholders. The separation also further clarifies the prioritization of capital allocation between the US and European operations and ensures that US capital structure and capital allocation decisions are independent of any Europe-related considerations.
The separation is to be effected by a spin-off of Altice NV’s 67.2% interest in Altice USA through a distribution in kind to Altice NV shareholders(5). Altice NV aims to complete the proposed transaction by the end of the second quarter 2018 following regulatory and Altice NV shareholder approvals.
Following this proposed transaction, the two companies will be led by separate management teams. Dexter Goei will continue to serve as CEO and a Director of Altice USA. Patrick Drahi, founder of Altice, will retain control of both companies and is committed to long-term ownership. Post-separation, Mr. Drahi will serve as Chairman of the Board of Altice USA.
Simultaneously, the Board of Directors of Altice USA approved in principle the payment of a $1.5 billion cash dividend to all shareholders immediately prior to completion of the separation. Formal approval of the dividend and setting of a record date are expected to occur in the second quarter of 2018. The payment of the dividend will be funded with new financing at Optimum which was raised in January 2018 and available Optimum revolving facility capacity. In addition, the Board of Directors of Altice USA has authorized a share repurchase program of $2 billion, effective following completion of the separation.
Following the announcement of the spin-off of Altice USA, Altice NV’s ownership of Altice Technical Services US has been transferred to Altice USA for a nominal consideration as previously announced.
(5) The distribution will exclude shares indirectly owned by Altice NV through Neptune Holding US LP (“Holding LP”).
4
Financial and Operational Review
For quarter ended December 31, 2017 compared to quarter ended December 31, 2016
· Reported revenue growth for Altice USA of +2.6% YoY in Q4 2017 to $2,365m:
· Optimum revenue growth+2.8% YoY
· Suddenlink revenue growth +2.4% YoY
· Adjusted EBITDA for Altice USA grew +12.2% YoY in Q4 2017 to $1,043m; Adjusted EBITDA margin increased 3.8 percentage points YoY to 44.1% (vs. 40.3% in Q4 2016):
· Optimum Adjusted EBITDA growth of +17.8% YoY; Adjusted EBITDA margin increased +5.5 percentage points YoY to 43.2% due to realisation of efficiency savings (vs. 37.7% in Q4 2016);
· Suddenlink Adjusted EBITDA growth +1.1% YoY; Adjusted EBITDA margin decreased -0.6 percentage points YoY to 46.1% mainly due to higher content expense from adding back Viacom content in Q4 2017 (vs. 46.7% in Q4 2016).
· Cash capex for Altice USA was $228m in Q4 2017 representing 9.6% of revenue.
· OpFCF for Altice USA grew +19.6% YoY in Q4 2017 to $815m:
· Optimum OpFCF growth +20.4% YoY;
· Suddenlink OpFCF growth +17.8% YoY.
· Altice USA saw total unique residential B2C customer relationship net additions of +6k in Q4 2017, including broadband RGU additions of +25k, -25k pay TV RGU losses and +10k telephony RGU additions (vs. +18k, +36k, -21k, -4k in Q4 2016 respectively). Altice USA ARPU per unique customer grew +1.5% in Q4 2017 to $140.2:
· Optimum’s base of unique residential B2C customer relationships grew +6k net additions in Q4, in line with last year, including broadband RGU additions of +17k, -19k pay TV RGU losses and +6k telephony RGU additions (compared to Q4 2016 with +6k unique customer additions, +15k broadband RGUs additions, -15k pay TV RGU losses and -7k telephony RGU losses). Altice USA continues to have a strong competitive position in the Optimum footprint, enhanced with the recent full commercial launch of Altice One. Increased demand for higher speed broadband tiers at Optimum continues to drive growth in residential ARPU per unique customer (+0.9% YoY).
· Suddenlink unique residential B2C customer relationship net losses of -1k in Q4 2017 compared to +13k additions in Q4 2016, mainly due to the slowdown in broadband RGU growth observed since Q3 with similar quarterly additions of +8k in Q4 2017 (vs. broadband RGUs of 9k in Q3 2017 and +20k in Q4 2016). Suddenlink’s bundle offerings have been rationalized and streamlined, as well as introducing more localized pricing and adding back Viacom content by the end of 2017. Together with the full commercial launch of Altice One at Suddenlink expected across Q2 / Q3 2018, these new offers are expected to contribute to improved customer metrics later this year. Pay TV RGU losses of -6k and telephony RGU additions of +4k were in line YoY (vs. -6k and +3k in Q4 2016 respectively). Increased demand for higher speed broadband tiers at Suddenlink continues to drive growth in residential ARPU per unique customer (+3.0% YoY).
· Altice USA’s Business Services (B2B) revenue increased 5.1% YoY in Q4 mainly due to growth in SMB +6.0% YoY with Enterprise & Carrier revenue increasing +3.5% YoY. Optimum had 263k and Suddenlink had 109k SMB customers as of the end of 2017.
5
· Altice USA’s advertising revenue increased 9.9% YoY in Q4 primarily due to an increase in digital advertising revenue and an increase in data and analytics revenue, partially offset by a decrease in political advertising. During Q4, Altice USA’s internal and customer-facing marketing capabilities have been reorganized into a single unit within its advertising business to drive synergies (Altice Media and Data Solutions). Following the acquisitions of Audience Partners and Place Media, Altice USA can now reach all US internet households with targeted digital advertising and 100m+ TV households with targeted video advertising.
· Altice USA’s programming costs increased +4.7% YoY in Q4 2017 (+3.3% in FY 2017) due primarily to an increase in contractual programming rates, partially offset by the decrease in video customers. Since the acquisitions of Suddenlink and Optimum, Altice USA has now successfully renewed programming contracts representing over 70% of its annual programming expense. We continue to expect programming costs per customer to increase by high single digits going forward:
· Optimum’s programming costs increased +3.3% YoY in Q4 2017 to $476m;
· Suddenlink’s programming costs increased +8.8% YoY in Q4 2017 to $160m.
· Altice USA has seen significant and rapid deleveraging at both Optimum and Suddenlink since the completion of their respective acquisitions as a result of underlying growth and improved cash flow generation. Altice USA reduced its target leverage range of 4.5-5.0x net debt to EBITDA in conjunction with the announcement of the spin-off from Altice NV. Net debt for Altice USA at the end of the fourth quarter was $20,743m, a reduction of $447m from the end of the third quarter(6). This represents consolidated LTM net leverage for Altice USA of 5.1x on a reported basis at the end of December 2017. Net leverage for Optimum was 5.1x and for Suddenlink was 5.3x at the end of December 2017 on LTM basis.
· Pro forma for the new financing at Optimum to fund the special cash dividend that is expected to be paid prior to completion of the spin-off of Altice USA from Altice NV and other refinancing in January 2018, Altice USA’s blended weighted average cost of debt was 6.2% (6.6% for Optimum, 5.5% for Suddenlink) and the blended weighted average life was 6.3 years at the end of December 2017.
(6) As adjusted for the special cash dividend of $1.5 billion to be paid in 2018 immediately prior to the spin-off of Altice USA, net debt was $22,243m at the end of the fourth quarter.
6
Altice USA Consolidated Operating Results
(Dollars in thousands, except per share data)
|
|
|
Three Months Ended December 31, |
|
Twelve Months Ended December 31, |
|
|
|
|
2017 |
|
2016 |
|
2017 |
|
2016 |
|
2016 |
|
|
|
|
Actual |
|
Actual |
|
Actual |
|
Pro Forma(1) |
|
Actual |
|
|
Revenue: |
|
|
|
|
|
|
|
|
|
|
|
|
Pay TV |
|
$ |
1,029,135 |
|
$ |
1,058,930 |
|
$ |
4,214,745 |
|
$ |
4,227,221 |
|
$ |
2,759,216 |
|
|
Broadband |
|
676,493 |
|
597,960 |
|
2,563,772 |
|
2,290,040 |
|
1,617,029 |
|
|
Telephony |
|
199,904 |
|
214,836 |
|
823,981 |
|
872,115 |
|
529,973 |
|
|
Business services and wholesale |
|
330,526 |
|
314,578 |
|
1,298,817 |
|
1,230,643 |
|
819,541 |
|
|
Advertising |
|
121,712 |
|
110,764 |
|
391,866 |
|
377,468 |
|
257,741 |
|
|
Other |
|
7,608 |
|
8,833 |
|
33,389 |
|
157,329 |
|
33,712 |
|
|
Total revenue |
|
2,365,378 |
|
2,305,901 |
|
9,326,570 |
|
9,154,816 |
|
6,017,212 |
|
|
Operating expenses: |
|
|
|
|
|
|
|
|
|
|
|
|
Programming and other direct costs |
|
763,508 |
|
733,422 |
|
3,035,655 |
|
2,999,785 |
|
1,911,230 |
|
|
Other operating expenses |
|
575,031 |
|
655,569 |
|
2,342,655 |
|
2,842,585 |
|
1,705,615 |
|
|
Restructuring and other expense |
|
9,636 |
|
85,309 |
|
152,401 |
|
229,774 |
|
240,395 |
|
|
Depreciation and amortization |
|
791,699 |
|
614,377 |
|
2,930,475 |
|
2,484,284 |
|
1,700,306 |
|
|
Operating income |
|
225,504 |
|
217,224 |
|
865,384 |
|
598,388 |
|
459,666 |
|
|
Other income (expense): |
|
|
|
|
|
|
|
|
|
|
|
|
Interest expense, net |
|
(369,854 |
) |
(439,651 |
) |
(1,601,211 |
) |
(1,760,421 |
) |
(1,442,730 |
) |
|
Gain on investments, net |
|
67,466 |
|
58,429 |
|
237,354 |
|
271,886 |
|
141,896 |
|
|
Loss on derivative contracts, net |
|
(82,060 |
) |
(27,124 |
) |
(236,330 |
) |
(89,979 |
) |
(53,696 |
) |
|
Gain (loss) on interest rate swap contracts |
|
(7,057 |
) |
(97,341 |
) |
5,482 |
|
(72,961 |
) |
(72,961 |
) |
|
Loss on extinguishment of debt and write-off of deferred financing costs |
|
— |
|
(107,701 |
) |
(600,240 |
) |
(127,649 |
) |
(127,649 |
) |
|
Other income (expense), net |
|
(2,620 |
) |
1,781 |
|
(1,788 |
) |
9,184 |
|
4,329 |
|
|
Loss before income taxes |
|
(168,621 |
) |
(394,383 |
) |
(1,331,349 |
) |
(1,171,552 |
) |
(1,091,145 |
) |
|
Income tax benefit |
|
2,423,303 |
|
158,334 |
|
2,852,967 |
|
450,295 |
|
259,666 |
|
|
Net income (loss) |
|
2,254,682 |
|
(236,049 |
) |
1,521,618 |
|
(721,257 |
) |
(831,479 |
) |
|
Net income attributable to noncontrolling interests |
|
(850 |
) |
(659 |
) |
(1,587 |
) |
(315 |
) |
(551 |
) |
|
Net income (loss) attributable to Altice USA stockholders |
|
$ |
2,253,832 |
|
$ |
(236,708 |
) |
$ |
1,520,031 |
|
$ |
(721,572 |
) |
$ |
(832,030 |
) |
|
Basic net income (loss) per share |
|
$ |
3.06 |
|
$ |
(0.36 |
) |
$ |
2.18 |
|
$ |
(1.11 |
) |
$ |
(1.28 |
) |
|
Basic weighted average common shares |
|
737,069 |
|
649,525 |
|
696,055 |
|
649,525 |
|
649,525 |
|
|
Diluted net income (loss) per share |
|
$ |
3.06 |
|
$ |
(0.36 |
) |
$ |
2.18 |
|
$ |
(1.11 |
) |
$ |
(1.28 |
) |
|
Diluted weighted average common shares |
|
737,069 |
|
649,525 |
|
696,055 |
|
649,525 |
|
649,525 |
|
Note: Certain reclassifications have been made to the 2016 amounts to conform to the 2017 presentation including Altice USA’s data analytics revenue being reported within Advertising.
7
Reconciliation of net loss to Adjusted EBITDA and Adjusted EBITDA less Cash Capital Expenditures:
We define Adjusted EBITDA, which is a non-GAAP financial measure, as net income (loss) excluding income taxes, income (loss) from discontinued operations, other non-operating income or expenses, loss on extinguishment of debt and write-off of deferred financing costs, gain (loss) on interest rate swap contracts, gain (loss) on derivative contracts, gain (loss) on investments, interest expense (including cash interest expense), interest income, depreciation and amortization (including impairments), share-based compensation expense or benefit, restructuring expense or credits and transaction expenses.
We believe Adjusted EBITDA is an appropriate measure for evaluating the operating performance of the Company. Adjusted EBITDA and similar measures with similar titles are common performance measures used by investors, analysts and peers to compare performance in our industry. Internally, we use revenue and Adjusted EBITDA measures as important indicators of our business performance, and evaluate management’s effectiveness with specific reference to these indicators. We believe Adjusted EBITDA provides management and investors a useful measure for period-to-period comparisons of our core business and operating results by excluding items that are not comparable across reporting periods or that do not otherwise relate to the Company’s ongoing operating results. Adjusted EBITDA should be viewed as a supplement to and not a substitute for operating income (loss), net income (loss), and other measures of performance presented in accordance with GAAP. Since Adjusted EBITDA is not a measure of performance calculated in accordance with GAAP, this measure may not be comparable to similar measures with similar titles used by other companies.
We also use Adjusted EBITDA less cash Capital Expenditures, or Operating Free Cash Flow, as an indicator of the Company’s financial performance. We believe this measure is one of several benchmarks used by investors, analysts and peers for comparison of performance in the Company’s industry, although it may not be directly comparable to similar measures reported by other companies.
8
Altice USA (Dollars in thousands, except per share data)
|
|
|
Altice USA |
|
|
|
|
Three Months Ended December 31, |
|
Twelve Months Ended December 31, |
|
|
|
|
2017 |
|
2016 |
|
2017 |
|
2016 |
|
2016 |
|
|
|
|
Actual |
|
Actual |
|
Actual |
|
Pro Forma(1) |
|
Actual |
|
|
Net income (loss) |
|
$ |
2,254,682 |
|
$ |
(236,049 |
) |
$ |
1,521,618 |
|
$ |
(721,257 |
) |
$ |
(831,479 |
) |
|
Income tax expense (benefit) |
|
(2,423,303 |
) |
(158,334 |
) |
(2,852,967 |
) |
(450,295 |
) |
(259,666 |
) |
|
Other expense (income), net |
|
2,620 |
|
(1,781 |
) |
1,788 |
|
(9,184 |
) |
(4,329 |
) |
|
Loss (gain) on interest rate swap contracts |
|
7,057 |
|
97,341 |
|
(5,482 |
) |
72,961 |
|
72,961 |
|
|
Loss on derivative contracts, net |
|
82,060 |
|
27,124 |
|
236,330 |
|
89,979 |
|
53,696 |
|
|
Gain on investments, net |
|
(67,466 |
) |
(58,429 |
) |
(237,354 |
) |
(271,886 |
) |
(141,896 |
) |
|
Loss on extinguishment of debt and write-off of deferred financing costs |
|
— |
|
107,701 |
|
600,240 |
|
127,649 |
|
127,649 |
|
|
Interest expense, net |
|
369,854 |
|
439,651 |
|
1,601,211 |
|
1,760,421 |
|
1,442,730 |
|
|
Depreciation and amortization |
|
791,699 |
|
614,377 |
|
2,930,475 |
|
2,484,284 |
|
1,700,306 |
|
|
Restructuring and other expenses |
|
9,636 |
|
85,309 |
|
152,401 |
|
229,774 |
|
240,395 |
|
|
Share-based compensation |
|
16,498 |
|
12,698 |
|
57,430 |
|
39,599 |
|
14,368 |
|
|
Adjusted EBITDA |
|
$ |
1,043,337 |
|
$ |
929,608 |
|
$ |
4,005,690 |
|
$ |
3,352,045 |
|
$ |
2,414,735 |
|
|
Capital Expenditures (accrued) |
|
362,972 |
|
319,916 |
|
1,044,305 |
|
1,035,542 |
|
700,679 |
|
|
Adjusted EBITDA less Capex (accrued) |
|
$ |
680,365 |
|
$ |
609,692 |
|
$ |
2,961,385 |
|
$ |
2,316,503 |
|
$ |
1,714,056 |
|
|
Capital Expenditures (cash) |
|
$ |
228,066 |
|
$ |
247,815 |
|
$ |
991,364 |
|
$ |
955,672 |
|
$ |
625,541 |
|
|
Adjusted EBITDA less Capex (cash) |
|
$ |
815,271 |
|
$ |
681,793 |
|
$ |
3,014,326 |
|
$ |
2,396,373 |
|
$ |
1,789,194 |
|
Cablevision (Dollars in thousands, except per share data)
|
|
|
Cablevision |
|
|
|
|
Three Months Ended December 31, |
|
Twelve Months Ended December 31, |
|
|
|
|
2017 |
|
2016 |
|
2017 |
|
2016 |
|
2016 |
|
|
|
|
Actual |
|
Actual |
|
Actual |
|
Pro Forma(1) |
|
Actual |
|
|
Operating income |
|
$ |
100,396 |
|
$ |
94,607 |
|
$ |
345,063 |
|
$ |
213,587 |
|
$ |
74,865 |
|
|
Depreciation and amortization |
|
610,137 |
|
437,608 |
|
2,251,614 |
|
1,747,643 |
|
963,665 |
|
|
Restructuring and other expenses |
|
7,202 |
|
80,650 |
|
112,384 |
|
201,529 |
|
212,150 |
|
|
Share-based compensation |
|
13,463 |
|
8,073 |
|
42,060 |
|
34,395 |
|
9,164 |
|
|
Adjusted EBITDA |
|
$ |
731,198 |
|
$ |
620,938 |
|
$ |
2,751,121 |
|
$ |
2,197,154 |
|
$ |
1,259,844 |
|
|
Capital Expenditures (accrued) |
|
254,028 |
|
204,427 |
|
724,130 |
|
683,715 |
|
348,852 |
|
|
Adjusted EBITDA less Capex (accrued) |
|
$ |
477,170 |
|
$ |
416,511 |
|
$ |
2,026,991 |
|
$ |
1,513,439 |
|
$ |
910,992 |
|
|
Capital Expenditures (cash) |
|
$ |
161,201 |
|
$ |
147,392 |
|
$ |
711,432 |
|
$ |
628,488 |
|
$ |
298,357 |
|
|
Adjusted EBITDA less Capex (cash) |
|
$ |
569,997 |
|
$ |
473,546 |
|
$ |
2,039,689 |
|
$ |
1,568,666 |
|
$ |
961,487 |
|
9
Suddenlink (Dollars in thousands, except per share data)
|
|
|
Suddenlink |
|
|
|
|
Three Months Ended December 31, |
|
Twelve Months Ended December 31, |
|
|
|
|
2017 |
|
2016 |
|
2017 |
|
2016 |
|
|
|
|
Actual |
|
Actual |
|
Actual |
|
Actual |
|
|
Operating income |
|
$ |
125,108 |
|
$ |
110,226 |
|
$ |
520,321 |
|
$ |
384,801 |
|
|
Depreciation and amortization |
|
181,562 |
|
176,769 |
|
678,861 |
|
736,641 |
|
|
Restructuring and other expenses |
|
2,434 |
|
17,050 |
|
40,017 |
|
28,245 |
|
|
Share-based compensation |
|
3,035 |
|
4,625 |
|
15,370 |
|
5,204 |
|
|
Adjusted EBITDA |
|
$ |
312,139 |
|
$ |
308,670 |
|
$ |
1,254,569 |
|
$ |
1,154,891 |
|
|
Capital Expenditures (accrued) |
|
108,944 |
|
115,489 |
|
320,175 |
|
351,827 |
|
|
Adjusted EBITDA less Capex (accrued) |
|
$ |
203,195 |
|
$ |
193,181 |
|
$ |
934,394 |
|
$ |
803,064 |
|
|
Capital Expenditures (cash) |
|
$ |
66,865 |
|
$ |
100,423 |
|
$ |
279,932 |
|
$ |
327,184 |
|
|
Adjusted EBITDA less Capex (cash) |
|
$ |
245,274 |
|
$ |
208,247 |
|
$ |
974,637 |
|
$ |
827,707 |
|
The following is the contribution from Newsday Media Group:
|
|
|
Altice USA ($m) |
|
|
|
|
Three Months Ended December 31, |
|
Twelve Months Ended December 31, |
|
|
|
|
|
2016 |
|
2016 |
|
|
Pro Forma Revenue |
|
$ |
2,305.9 |
|
$ |
9,154.8 |
|
|
Less Newsday |
|
0.0 |
|
115.4 |
|
|
Pro Forma Excluding Newsday |
|
$ |
2,305.9 |
|
$ |
9,039.4 |
|
|
|
|
|
|
|
|
|
|
10
The following table sets forth certain customer metrics by segment (unaudited):
Altice USA Customer Metrics
|
In thousands |
|
|
FY-15 |
|
|
Q1-16 |
|
Q2-16 |
|
Q3-16 |
|
Q4-16 |
|
|
FY-16 |
|
|
Q1-17 |
|
Q2-17 |
|
Q3-17 |
|
Q4-17 |
|
|
FY-17 |
|
|
|
|
|
|
|
|
|
|
|
|
|
|
|
|
|
|
|
|
|
|
|
|
|
|
|
|
|
|
|
|
|
|
Homes Passed (1) |
|
|
8,428.1 |
|
|
8,447.9 |
|
8,467.6 |
|
8,493.7 |
|
8,523.6 |
|
|
8,523.6 |
|
|
8,547.2 |
|
8,570.1 |
|
8,577.2 |
|
8,620.9 |
|
|
8,620.9 |
|
|
|
|
|
|
|
|
|
|
|
|
|
|
|
|
|
|
|
|
|
|
|
|
|
|
|
|
|
|
|
|
|
|
Residential (B2C) |
|
|
4,475.5 |
|
|
4,504.5 |
|
4,510.3 |
|
4,509.7 |
|
4,528.2 |
|
|
4,528.2 |
|
|
4,548.4 |
|
4,536.9 |
|
4,529.0 |
|
4,535.0 |
|
|
4,535.0 |
|
|
|
SMB (B2B) |
|
|
351.7 |
|
|
354.1 |
|
358.7 |
|
361.0 |
|
363.6 |
|
|
363.6 |
|
|
364.7 |
|
367.3 |
|
369.1 |
|
371.3 |
|
|
371.3 |
|
|
|
Total Unique Customer Relationships (2) |
|
|
4,827.2 |
|
|
4,858.6 |
|
4,869.0 |
|
4,870.7 |
|
4,891.8 |
|
|
4,891.8 |
|
|
4,913.1 |
|
4,904.3 |
|
4,898.1 |
|
4,906.3 |
|
|
4,906.3 |
|
|
|
|
|
|
|
|
|
|
|
|
|
|
|
|
|
|
|
|
|
|
|
|
|
|
|
|
|
|
|
|
|
|
Pay TV |
|
|
3,640.4 |
|
|
3,622.9 |
|
3,596.0 |
|
3,555.9 |
|
3,534.5 |
|
|
3,534.5 |
|
|
3,499.8 |
|
3,462.7 |
|
3,430.2 |
|
3,405.5 |
|
|
3,405.5 |
|
|
|
Broadband |
|
|
3,838.2 |
|
|
3,888.1 |
|
3,909.4 |
|
3,926.9 |
|
3,962.5 |
|
|
3,962.5 |
|
|
4,002.8 |
|
4,004.4 |
|
4,020.9 |
|
4,046.2 |
|
|
4,046.2 |
|
|
|
Telephony |
|
|
2,588.3 |
|
|
2,595.6 |
|
2,589.7 |
|
2,562.6 |
|
2,559.0 |
|
|
2,559.0 |
|
|
2,551.0 |
|
2,543.8 |
|
2,547.2 |
|
2,557.4 |
|
|
2,557.4 |
|
|
|
Total B2C RGUs |
|
|
10,066.9 |
|
|
10,106.6 |
|
10,095.1 |
|
10,045.4 |
|
10,056.1 |
|
|
10,056.1 |
|
|
10,053.6 |
|
10,010.9 |
|
9,998.3 |
|
10,009.1 |
|
|
10,009.1 |
|
|
|
|
|
|
|
|
|
|
|
|
|
|
|
|
|
|
|
|
|
|
|
|
|
|
|
|
|
|
|
|
|
|
B2C ARPU ($) (3) |
|
|
134.2 |
|
|
135.3 |
|
136.7 |
|
136.5 |
|
138.1 |
|
|
136.8 |
|
|
139.1 |
|
139.3 |
|
140.1 |
|
140.2 |
|
|
139.8 |
|
|
Optimum Customer Metrics
|
In thousands |
|
|
FY-15 |
|
|
Q1-16 |
|
Q2-16 |
|
Q3-16 |
|
Q4-16 |
|
|
FY-16 |
|
|
Q1-17 |
|
Q2-17 |
|
Q3-17 |
|
Q4-17 |
|
|
FY-17 |
|
|
|
|
|
|
|
|
|
|
|
|
|
|
|
|
|
|
|
|
|
|
|
|
|
|
|
|
|
|
|
|
|
|
Homes Passed (1) |
|
|
5,075.9 |
|
|
5,085.6 |
|
5,093.6 |
|
5,105.2 |
|
5,116.2 |
|
|
5,116.2 |
|
|
5,128.4 |
|
5,139.7 |
|
5,134.4 |
|
5,163.9 |
|
|
5,163.9 |
|
|
|
|
|
|
|
|
|
|
|
|
|
|
|
|
|
|
|
|
|
|
|
|
|
|
|
|
|
|
|
|
|
|
Residential (B2C) |
|
|
2,857.5 |
|
|
2,866.4 |
|
2,882.4 |
|
2,873.4 |
|
2,879.1 |
|
|
2,879.1 |
|
|
2,886.9 |
|
2,889.1 |
|
2,887.0 |
|
2,893.4 |
|
|
2,893.4 |
|
|
|
SMB (B2B) |
|
|
258.0 |
|
|
258.2 |
|
260.7 |
|
261.2 |
|
262.0 |
|
|
262.0 |
|
|
261.2 |
|
261.8 |
|
261.9 |
|
262.6 |
|
|
262.6 |
|
|
|
Total Unique Customer Relationships (2) |
|
|
3,115.5 |
|
|
3,124.6 |
|
3,143.1 |
|
3,134.6 |
|
3,141.1 |
|
|
3,141.1 |
|
|
3,148.2 |
|
3,150.9 |
|
3,148.9 |
|
3,156.0 |
|
|
3,156.0 |
|
|
|
|
|
|
|
|
|
|
|
|
|
|
|
|
|
|
|
|
|
|
|
|
|
|
|
|
|
|
|
|
|
|
Pay TV |
|
|
2,486.5 |
|
|
2,472.6 |
|
2,470.2 |
|
2,442.8 |
|
2,427.8 |
|
|
2,427.8 |
|
|
2,412.8 |
|
2,400.9 |
|
2,382.2 |
|
2,363.2 |
|
|
2,363.2 |
|
|
|
Broadband |
|
|
2,561.9 |
|
|
2,580.2 |
|
2,603.6 |
|
2,603.4 |
|
2,618.9 |
|
|
2,618.9 |
|
|
2,636.4 |
|
2,646.0 |
|
2,653.1 |
|
2,670.0 |
|
|
2,670.0 |
|
|
|
Telephony |
|
|
2,006.9 |
|
|
1,998.9 |
|
1,993.7 |
|
1,968.7 |
|
1,962.0 |
|
|
1,962.0 |
|
|
1,955.0 |
|
1,954.3 |
|
1,958.8 |
|
1,965.0 |
|
|
1,965.0 |
|
|
|
Total B2C RGUs |
|
|
7,055.3 |
|
|
7,051.7 |
|
7,067.5 |
|
7,014.9 |
|
7,008.7 |
|
|
7,008.7 |
|
|
7,004.2 |
|
7,001.2 |
|
6,994.1 |
|
6,998.2 |
|
|
6,998.2 |
|
|
|
|
|
|
|
|
|
|
|
|
|
|
|
|
|
|
|
|
|
|
|
|
|
|
|
|
|
|
|
|
|
|
B2C ARPU ($) (3) |
|
|
151.4 |
|
|
152.2 |
|
153.5 |
|
152.6 |
|
154.5 |
|
|
153.4 |
|
|
155.8 |
|
156.0 |
|
156.9 |
|
155.8 |
|
|
156.2 |
|
|
Suddenlink Customer Metrics
|
In thousands |
|
|
FY-15 |
|
|
Q1-16 |
|
Q2-16 |
|
Q3-16 |
|
Q4-16 |
|
|
FY-16 |
|
|
Q1-17 |
|
Q2-17 |
|
Q3-17 |
|
Q4-17 |
|
|
FY-17 |
|
|
|
|
|
|
|
|
|
|
|
|
|
|
|
|
|
|
|
|
|
|
|
|
|
|
|
|
|
|
|
|
|
|
Homes Passed (1) |
|
|
3,352.2 |
|
|
3,362.2 |
|
3,374.0 |
|
3,388.5 |
|
3,407.4 |
|
|
3,407.4 |
|
|
3,418.7 |
|
3,430.4 |
|
3,442.8 |
|
3,457.1 |
|
|
3,457.1 |
|
|
|
|
|
|
|
|
|
|
|
|
|
|
|
|
|
|
|
|
|
|
|
|
|
|
|
|
|
|
|
|
|
|
Residential (B2C) |
|
|
1,618.0 |
|
|
1,638.1 |
|
1,628.0 |
|
1,636.3 |
|
1,649.1 |
|
|
1,649.1 |
|
|
1,661.5 |
|
1,647.8 |
|
1,642.0 |
|
1,641.5 |
|
|
1,641.5 |
|
|
|
SMB (B2B) |
|
|
93.7 |
|
|
95.9 |
|
98.0 |
|
99.8 |
|
101.6 |
|
|
101.6 |
|
|
103.4 |
|
105.5 |
|
107.2 |
|
108.7 |
|
|
108.7 |
|
|
|
Total Unique Customer Relationships (2) |
|
|
1,711.7 |
|
|
1,734.0 |
|
1,725.9 |
|
1,736.1 |
|
1,750.7 |
|
|
1,750.7 |
|
|
1,764.9 |
|
1,753.3 |
|
1,749.2 |
|
1,750.2 |
|
|
1,750.2 |
|
|
|
|
|
|
|
|
|
|
|
|
|
|
|
|
|
|
|
|
|
|
|
|
|
|
|
|
|
|
|
|
|
|
Pay TV |
|
|
1,153.9 |
|
|
1,150.3 |
|
1,125.8 |
|
1,113.1 |
|
1,106.7 |
|
|
1,106.7 |
|
|
1,087.0 |
|
1,061.8 |
|
1,048.0 |
|
1,042.4 |
|
|
1,042.4 |
|
|
|
Broadband |
|
|
1,276.3 |
|
|
1,307.9 |
|
1,305.9 |
|
1,323.5 |
|
1,343.7 |
|
|
1,343.7 |
|
|
1,366.5 |
|
1,358.4 |
|
1,367.8 |
|
1,376.2 |
|
|
1,376.2 |
|
|
|
Telephony |
|
|
581.4 |
|
|
596.7 |
|
596.0 |
|
594.0 |
|
597.0 |
|
|
597.0 |
|
|
596.0 |
|
589.5 |
|
588.4 |
|
592.3 |
|
|
592.3 |
|
|
|
Total B2C RGUs |
|
|
3,011.6 |
|
|
3,054.9 |
|
3,027.6 |
|
3,030.5 |
|
3,047.4 |
|
|
3,047.4 |
|
|
3,049.4 |
|
3,009.7 |
|
3,004.2 |
|
3,010.9 |
|
|
3,010.9 |
|
|
|
|
|
|
|
|
|
|
|
|
|
|
|
|
|
|
|
|
|
|
|
|
|
|
|
|
|
|
|
|
|
|
B2C ARPU ($) (3) |
|
|
103.4 |
|
|
105.7 |
|
107.0 |
|
108.2 |
|
109.3 |
|
|
107.6 |
|
|
110.0 |
|
110.0 |
|
110.6 |
|
112.6 |
|
|
111.1 |
|
|
11
(1) Homes passed represents the estimated number of single residence homes, apartments and condominium units passed by the cable distribution network in areas serviceable without further extending the transmission lines. In addition, it includes commercial establishments that have connected to our cable distribution network. For Cequel, broadband services were not available to approximately 100 homes passed and telephony services were not available to approximately 500 homes passed.
(2) Customers represent each customer account (set up and segregated by customer name and address), weighted equally and counted as one customer, regardless of size, revenue generated, or number of boxes, units, or outlets. In calculating the number of customers, we count all customers other than inactive/disconnected customers. Free accounts are included in the customer counts along with all active accounts, but they are limited to a prescribed group. Most of these accounts are also not entirely free, as they typically generate revenue through pay-per-view or other pay services and certain equipment fees. Free status is not granted to regular customers as a promotion. In counting bulk residential customers, such as an apartment building, we count each subscribing family unit within the building as one customer, but do not count the master account for the entire building as a customer. We count a bulk commercial customer, such as a hotel, as one customer, and do not count individual room units at that hotel.
(3) ARPU calculated by dividing the average monthly revenue for the respective quarter or annual periods derived from the sale of broadband, pay television and telephony services to residential customers for the respective quarter by the average number of total residential customers for the same period.
12
Consolidated Net Debt as of December 31, 2017, breakdown by credit silo
|
Suddenlink (Cequel) - In $m |
|
Actual |
|
Coupon / Margin |
|
Maturity |
|
|
Sn. Sec. Notes |
|
$ |
1,100 |
|
5.375% |
|
2023 |
|
|
Sn. Sec. Notes |
|
1,500 |
|
5.500% |
|
2026 |
|
|
Term Loan |
|
1,259 |
|
L+2.250% |
|
2025 |
|
|
Suddenlink Sec. Debt |
|
3,859 |
|
|
|
|
|
|
Senior Notes due 2020 |
|
1,050 |
|
6.375% |
|
2020 |
|
|
Senior Notes due 2021 |
|
1,250 |
|
5.125% |
|
2021 |
|
|
Senior Notes/Holdco Exchange Notes |
|
620 |
|
7.750% |
|
2025 |
|
|
Other Debt & Leases(7) |
|
7 |
|
|
|
|
|
|
Suddenlink Gross Debt |
|
6,786 |
|
|
|
|
|
|
Total Cash |
|
(82 |
) |
|
|
|
|
|
Suddenlink Net Debt |
|
6,704 |
|
|
|
|
|
|
Undrawn RCF(8) |
|
336 |
|
|
|
|
|
|
WACD (%) |
|
5.5 |
% |
|
|
|
|
|
|
|
|
|
|
|
|
|
(7) Excludes $3m of short term notes payable.
(8) At December 31, 2017, $14m of the revolving credit facility was restricted for certain letters of credit issued on behalf of the Company and $336m of the facility was undrawn and available, subject to covenant limitations.
13
|
Cablevision (Optimum) - in $m |
|
Actual |
|
Pro
Forma |
|
Coupon /
Margin |
|
Maturity |
|
|
Guaranteed Notes - LLC |
|
$ |
1,310 |
|
$ |
1,310 |
|
5.500% |
|
2027 |
|
|
Guaranteed Notes Acq.- LLC |
|
1,000 |
|
1,000 |
|
6.625% |
|
2025 |
|
|
Guaranteed Notes |
|
— |
|
1,000 |
|
5.375% |
|
2028 |
|
|
Senior Notes Acq. - LLC |
|
1,800 |
|
1,800 |
|
10.125% |
|
2023 |
|
|
Senior Notes Acq. — LLC |
|
1,684 |
|
1,684 |
|
10.875% |
|
2025 |
|
|
Senior Debentures - LLC |
|
300 |
|
— |
|
7.875% |
|
2018 |
|
|
Senior Debentures - LLC |
|
500 |
|
500 |
|
7.625% |
|
2018 |
|
|
Senior Notes - LLC |
|
526 |
|
526 |
|
8.625% |
|
2019 |
|
|
Senior Notes - LLC |
|
1,000 |
|
1,000 |
|
6.750% |
|
2021 |
|
|
Senior Notes - LLC |
|
750 |
|
750 |
|
5.250% |
|
2024 |
|
|
Term Loan |
|
2,985 |
|
2,985 |
|
L+2.250% |
|
2025 |
|
|
Term Loan |
|
— |
|
1,500 |
|
L+2.50% |
|
2026 |
|
|
Drawn RCF |
|
450 |
|
500 |
|
L+3.250% |
|
2021 |
|
|
Other Debt & Leases(9) |
|
26 |
|
26 |
|
|
|
|
|
|
Cablevision Total Debt LLC |
|
12,331 |
|
14,581 |
|
|
|
|
|
|
Senior Notes - Corp |
|
750 |
|
— |
|
7.750% |
|
2018 |
|
|
Senior Notes - Corp |
|
500 |
|
500 |
|
8.000% |
|
2020 |
|
|
Senior Notes - Corp |
|
649 |
|
649 |
|
5.875% |
|
2022 |
|
|
Cablevision Total Debt Corp |
|
14,230 |
|
15,730 |
|
|
|
|
|
|
Total Cash |
|
(186 |
) |
(186 |
) |
|
|
|
|
|
Cablevision Net Debt |
|
14,043 |
|
15,544 |
|
|
|
|
|
|
Undrawn RCF(10) |
|
1,734 |
|
1,684 |
|
|
|
|
|
|
WACD (%) |
|
|
|
6.6 |
% |
|
|
|
|
|
|
|
|
|
|
|
|
|
|
|
|
(9) Excludes $51m of notes payable ($21m related to collateralized debt and $30m of ST maturities).
(10) At December 31, 2017, $116m of the revolving credit facility was restricted for certain letters of credit issued on behalf of the Company and $1,734m of the facility was undrawn and available, subject to covenant limitations.
14
Altice USA Pro Forma Net Leverage Reconciliation as of December 31, 2017
|
In $m |
|
|
|
|
|
|
|
|
|
|
Altice USA |
|
Suddenlink |
|
Optimum |
|
Altice USA Inc |
|
Pro Forma |
|
|
Gross Debt Consolidated |
|
$ |
6,786 |
|
$ |
15,730 |
|
$ |
— |
|
$ |
22,516 |
|
|
Cash |
|
(82 |
) |
(186 |
) |
(5 |
) |
(273 |
) |
|
Net Debt Consolidated |
|
6,704 |
|
15,545 |
|
(5 |
) |
22,243 |
|
|
LTM EBITDA GAAP(11) |
|
1,265 |
|
2,771 |
|
|
|
4,004 |
|
|
L2QA EBITDA GAAP(11) |
|
1,259 |
|
2,911 |
|
|
|
4,170 |
|
|
Net Leverage (LTM) |
|
5.3 |
x |
5.6 |
x |
|
|
5.5 |
x |
|
Net Leverage (L2QA) |
|
5.3 |
x |
5.3 |
x |
|
|
5.3 |
x |
|
WACD |
|
5.5 |
% |
6.6 |
% |
|
|
6.2 |
% |
|
|
|
|
|
|
|
|
|
|
|
|
|
|
|
In $m |
|
|
|
|
|
|
Altice USA Reconciliation to Financial Reported Debt |
|
Actual |
|
Pro Forma |
|
|
Total Debenture and Loans from Financial Institutions (Carrying Amount)(12) |
|
$ |
20,504 |
|
$ |
20,504 |
|
|
Unamortized Financing Costs |
|
293 |
|
293 |
|
|
Fair Value Adjustments |
|
186 |
|
186 |
|
|
Total Value of Debenture and Loans from Financial Institutions (Principal Amount)(12) |
|
20,983 |
|
20,983 |
|
|
Other Debt & Capital Leases |
|
33 |
|
33 |
|
|
Refinancing Impact |
|
— |
|
1,500 |
|
|
Gross Debt Consolidated |
|
21,016 |
|
22,516 |
|
|
Cash |
|
(273 |
) |
(273 |
) |
|
Net Debt Consolidated |
|
20,743 |
|
22,243 |
|
|
|
|
|
|
|
|
|
(11) Excluding management fees.
(12) Excluding debt collateralized by Comcast shares.
15
Cablevision Operating Results
(Dollars in thousands, except per share data)
|
|
|
Three Months Ended December 31, |
|
Twelve Months Ended December 31, |
|
|
|
|
2017 |
|
2016 |
|
2017 |
|
2016 |
|
2016 |
|
|
|
|
Actual |
|
Actual |
|
Actual |
|
Pro Forma |
|
Actual |
|
|
Revenue: |
|
|
|
|
|
|
|
|
|
|
|
|
Pay TV |
|
$ |
757,008 |
|
$ |
778,759 |
|
$ |
3,113,238 |
|
$ |
3,106,697 |
|
$ |
1,638,691 |
|
|
Broadband |
|
425,284 |
|
376,558 |
|
1,603,015 |
|
1,455,625 |
|
782,615 |
|
|
Telephony |
|
168,782 |
|
177,752 |
|
693,478 |
|
718,176 |
|
376,034 |
|
|
Business services and wholesale |
|
232,993 |
|
223,947 |
|
923,161 |
|
879,734 |
|
468,632 |
|
|
Advertising |
|
104,899 |
|
85,869 |
|
321,149 |
|
289,097 |
|
169,370 |
|
|
Other |
|
2,280 |
|
2,608 |
|
10,747 |
|
132,327 |
|
8,710 |
|
|
Total revenue |
|
1,691,246 |
|
1,645,493 |
|
6,664,788 |
|
6,581,656 |
|
3,444,052 |
|
|
Operating expenses: |
|
|
|
|
|
|
|
|
|
|
|
|
Programming and other direct costs |
|
569,817 |
|
548,065 |
|
2,280,062 |
|
2,253,480 |
|
1,164,925 |
|
|
Other operating expenses |
|
403,694 |
|
484,563 |
|
1,675,665 |
|
2,165,417 |
|
1,028,447 |
|
|
Restructuring and other expense |
|
7,202 |
|
80,650 |
|
112,384 |
|
201,529 |
|
212,150 |
|
|
Depreciation and amortization |
|
610,137 |
|
437,608 |
|
2,251,614 |
|
1,747,643 |
|
963,665 |
|
|
Operating income |
|
$ |
100,396 |
|
$ |
94,607 |
|
$ |
345,063 |
|
$ |
213,587 |
|
$ |
74,865 |
|
16
Suddenlink Operating Results
(Dollars in thousands, except per share data)
|
|
|
Three Months Ended December 31, |
|
Twelve Months Ended December 31, |
|
|
|
|
2017 |
|
2016 |
|
2017 |
|
2016 |
|
|
|
|
Actual |
|
Actual |
|
Actual |
|
Actual |
|
|
Revenue: |
|
|
|
|
|
|
|
|
|
|
Pay TV |
|
$ |
272,127 |
|
$ |
280,171 |
|
$ |
1,101,507 |
|
$ |
1,120,525 |
|
|
Broadband |
|
251,209 |
|
221,402 |
|
960,757 |
|
834,414 |
|
|
Telephony |
|
31,122 |
|
37,084 |
|
130,503 |
|
153,939 |
|
|
Business services and wholesale |
|
97,533 |
|
90,631 |
|
375,656 |
|
350,909 |
|
|
Advertising |
|
19,125 |
|
24,895 |
|
73,509 |
|
88,371 |
|
|
Other |
|
5,328 |
|
6,224 |
|
22,642 |
|
25,002 |
|
|
Total revenue |
|
676,444 |
|
660,407 |
|
2,664,574 |
|
2,573,160 |
|
|
Operating expenses: |
|
|
|
|
|
|
|
|
|
|
Programming and other direct costs |
|
196,110 |
|
185,355 |
|
758,189 |
|
746,305 |
|
|
Other operating expenses |
|
171,230 |
|
171,007 |
|
667,186 |
|
677,168 |
|
|
Restructuring and other expense |
|
2,434 |
|
17,050 |
|
40,017 |
|
28,245 |
|
|
Depreciation and amortization |
|
181,562 |
|
176,769 |
|
678,861 |
|
736,641 |
|
|
Operating income |
|
$ |
125,108 |
|
$ |
110,226 |
|
$ |
520,321 |
|
$ |
384,801 |
|
Contacts
Head of Investor Relations
Nick Brown: +41 79 720 15 03 / nick.brown@altice.net
Head of Communications Altice NV
Arthur Dreyfuss: +41 79 946 49 31 / arthur.dreyfuss@altice.net
Head of Communications Altice USA
Lisa Anselmo: +1 929 418 4362 / lisa.anselmo@alticeusa.com
About Altice USA
Altice USA (NYSE: ATUS), the U.S. business of Altice N.V. (Euronext: ATC, ATCB), is one of the largest broadband communications and video services providers in the United States, delivering broadband, pay television, telephony services, Wi-Fi hotspot access, proprietary content and advertising services to approximately 4.9 million residential and business customers across 21 states through its Optimum and Suddenlink brands.
17
Miscellaneous
Altice USA has filed a registration statement with the Securities and Exchange Commission (SEC) for the offering to which this presentation relates. You should read the preliminary prospectus in that registration statement and other documents Altice USA has filed with the SEC for more complete information about Altice USA. You may get these documents for free by visiting EDGAR on the SEC website at www.sec.gov. Alternatively, you may also request a copy of the current preliminary prospectus, at no cost, by mail to Lisa Anselmo, Altice USA, Inc., 1 Court Square West, Long Island City, NY 11101 USA. To review a filed copy of the current registration statement and preliminary prospectus, click the following link on the SEC website at www.sec.gov as follows (or if such address has changed, by reviewing ATUS filings for the relevant date on the SEC website):
https://www.sec.gov/Archives/edgar/data/1702780/000104746918000085/a2234168zs-1.htm
Altice USA will publish an EU prospectus in connection with the distribution to which this presentation relates. Upon approval by the Netherlands Authority for the Financial Markets (AFM) and, to the extent relevant, notification for passporting in relevant Member States of the European EconomicArea in accordance with article 18 of the Directive 2003/71/EC, the EU prospectus will be made available on the website of Altice N.V. and, upon request, a hard copy will be available free of charge by Altice USA.
***
18
Altice USA Full Year and Q4 2017 Results February 27, 2018
Disclaimer FORWARD-LOOKING STATEMENTS Certain statements in this presentation constitute forward-looking statements within the meaning of the Private Securities Litigation Reform Act of 1995. These forward-looking statements include, but are not limited to, all statements other than statements of historical facts contained in this presentation, including, without limitation, those regarding our intentions, beliefs or current expectation s concerning, among other things: our future financial conditions and performance, results of operations and liquidity; our stra tegy, plans, objectives, prospects, growth, goals and targets; and future developments in the markets in which we participate or are seeking to partic ipate. These forward-looking statements can be identified by the use of forward-looking terminology, including the terms “believe”, “could”, “estimate”, “expect”, “forecast”, “intend”, “may”, “plan”, “project” or “will” or, in each case, their negative, or other variations or comparable terminology. Where, in any forward-looking statement, we express an expectation or belief as to future results or events, such expectation or belief is expressed in good faith and believed to have a reasonable basis, but there can be no assurance that the expectation or belief will result or be achieved or accomplished. To the extent that statements in this presentation are not recitations of historical fact, such statements constitute forward-looking statements, which, by definition, involve risks and uncertainties that could cause actual results to differ materially from those expressed or implied by such statements including risks referred to in our annual and quarterly reports. NON-GAAP FINANCIAL MEASURES We define Adjusted EBITDA, which is a non-GAAP financial measure, as net income (loss) excluding income taxes, income (loss) from discontinued operations, other non-operating income or expenses, loss on extinguishment of debt and write-off of deferred financing costs, gain (loss) on interest rate swap contracts, gain (loss) on derivative contracts, gain (loss) on investments, interest expense (including cash interest expense), interest income, depreciation and amortization (including impairments), share -based compensation expense or benefit, restructuring expense or credits and transaction expenses. We believe Adjusted EBITDA is an appropriate measure for evaluating the operating performance of the Company. Adjusted EBITDA and similar measures with similar titles are common performance measures used by investors, analysts and peers to compare performance in our industry. Internally, we use revenue and Adjusted EBITDA measures as important indicators of our business performance, and evaluate management’s effectiveness with specific reference to these indicators. We believe Adjusted EBITDA pro vides management and investors a useful measure for period-to-period comparisons of our core business and operating results by excluding items that are not comparable across reporting periods or that do not otherwise relate to the Company’s ongoing operating results. Adjusted EBITDA should be viewed as a supplement to and not a substitute for operating income (loss), net income (loss), and other measures of performance presented in accordance with GAAP. Since Adjusted EBITDA is not a measure of performance calculate d in accordance with GAAP, this measure may not be comparable to similar measures with similar titles used by other companies. We also use Adjusted EBITDA less cash Capital Expenditures, or Operating Free Cash Flow (“OpFCF”), as an indicator of the Company’s financial performance. We believe this measure is one of several benchmarks used by inve stors, analysts and peers for comparison of performance in the Company’s industry, although it may not be directly comparable to similar measures reported by other compa nies. For an explanation of why Altice USA uses these measures and a reconciliation of the Non -GAAP measures to net income (loss), please see the Full Year and Fourth Quarter 2017 (“Q417”) earnings release for Altice USA posted on the Altice USA website. MISCELLANEOUS Altice USA has filed a registration statement with the Securities and Exchange Commission (SEC) for the offering to which thi s presentation relates. You should read the preliminary prospectus in that registration statement and other documents Altice US A has filed with the SEC for more complete information about Altice USA. You may get these documents for free by visiting EDGAR on the SEC website at www.sec.gov. Alternatively, you may also request a copy of the current preliminary prospectus, at no cost, by mail to Lisa Anselmo, Altice USA, Inc., 1 Court Square West, Long Island City, NY 11101 USA. To review a filed copy of the current registration statement and preliminary prospectus, click the following link on the SEC website at www.sec.gov as follows (or if such address has changed, by reviewing ATUS filings for the relevant date on the SEC website): https://www.sec.gov/Archives/edgar/data/1702780/000104746918000085/a2234168zs-1.htm Altice USA will publish an EU prospectus in connection with the distribution to which this presentation relates. Upon approva l by the Netherlands Authority for the Financial Markets (AFM) and, to the extent relevant, notification for passporting in relevant Member States of the European Economic Area in accordance with article 18 of the Directive 2003/71/EC, the EU prospectus will be made availabl e on the website of Altice N.V. and, upon request, a hard copy will be available free of charge by Altice USA. 2
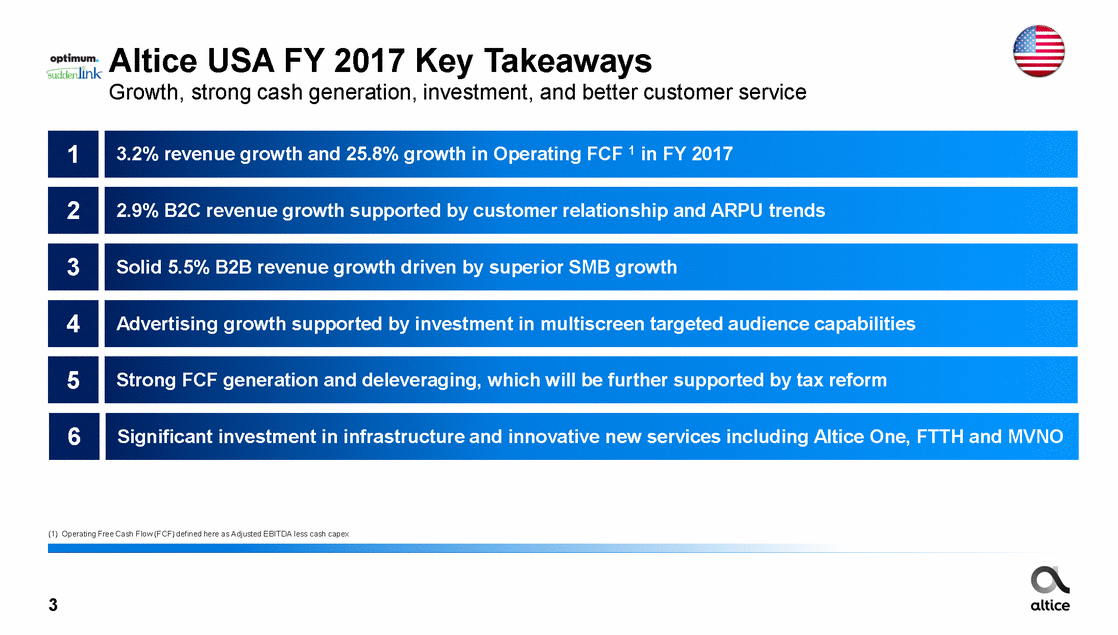
Altice USA FY 2017 Key Takeaways Growth, strong cash generation, investment, and better customer service 3.2% revenue growth and 25.8% growth in Operating FCF 1 in FY 2017 2.9% B2C revenue growth supported by customer relationship and ARPU trends Solid 5.5% B2B revenue growth driven by superior SMB growth Advertising growth supported by investment in multiscreen targeted audience capabilities Strong FCF generation and deleveraging, which will be further supported by tax reform Significant investment in infrastructure and innovative new services including Altice One, FTTH and MVNO (1) Operating Free Cash Flow (FCF) defined here as Adjusted EBITDA less cash capex 3 6 5 4 3 2 1
Altice USA Spin-Off Key Capital Markets Considerations Increased free float, independent and new shareholder returns policy Special cash dividend of $1.5bn Authorized share repurchase program of $2.0bn Free float of Altice USA A-shares to increase from c.10% to c.42%1 Leverage target reduced to 4.5x to 5.0x net debt to EBITDA Ensures US capital structure and capital allocation decisions are independent (1) c.42% free float based on public minorities economic ownership of Altice USA A and B shares, excluding sponsors and the Next and parties in concert with Next 4 5 4 3 2 1
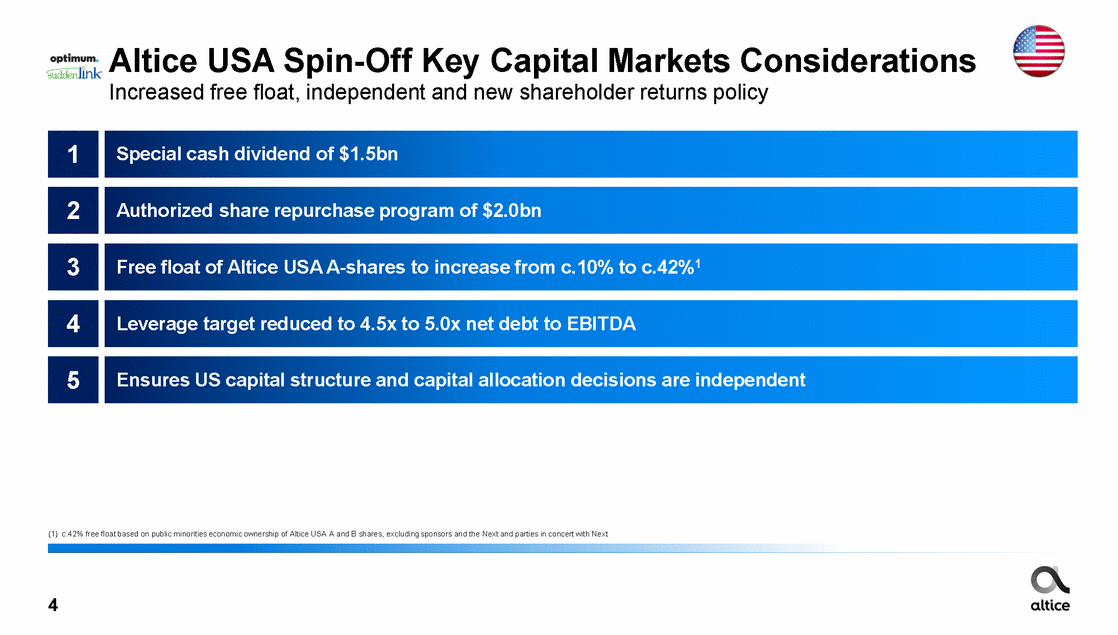
Altice USA Revenue Growth Strong revenue growth across B2C, B2B, and Advertising Components of revenue growth ($m) +3.2% Total Altice USA: +3.2% in FY 2017 (+2.6% in Q4-17) 9,327 9,039 33 Other Advertising 42 1,299 Residential (B2C): +2.9% in FY 2017 (+1.8% in Q4-17) 1,231 B2B +2.6% Business Services (B2B): +5.5% in FY 2017 (+5.1% in Q4-17) 2,365 122 2,306 111 8 9 331 315 Advertising 2: +3.8% in FY 2017 (+9.9% in Q4-17) 7,602 B2C 7,389 1,872 1,906 2016 1 (1) FY 2016 revenue excludes Newsday (2) Advertising includes Altice USA’s data analytics revenue 2017 Q4-16 Q4-17 5 377 392
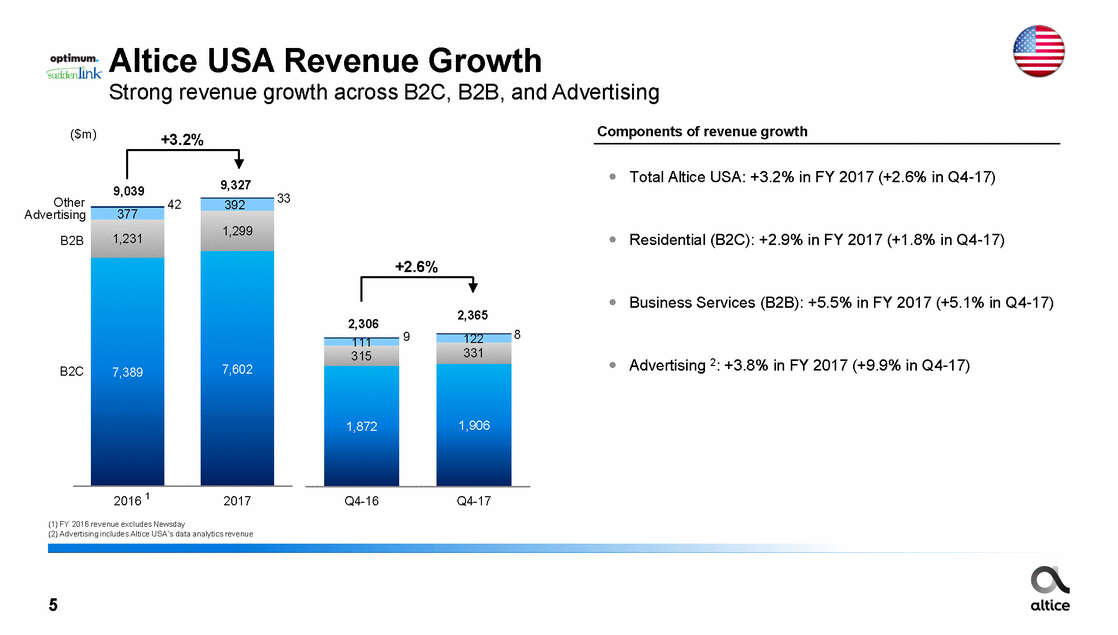
Altice USA Residential (B2C) Continued positive customer and ARPU trends 2017 vs. 2016 Q4-17 vs. Q4-16 B2C customer relationships ARPU per unique customer B2C customer relationships ARPU per unique customer (‘000) ($) (‘000) ($) +0.1% +0.1% +1.5% +2.2% 4,535 4,535 140 4,528 140 4,528 138 137 Q4-16 Q4-17 2016 2017 Q4-16 Q4-17 2016 2017 B2C revenue growth: +2.9% YoY B2C revenue growth: +1.8% YoY 6
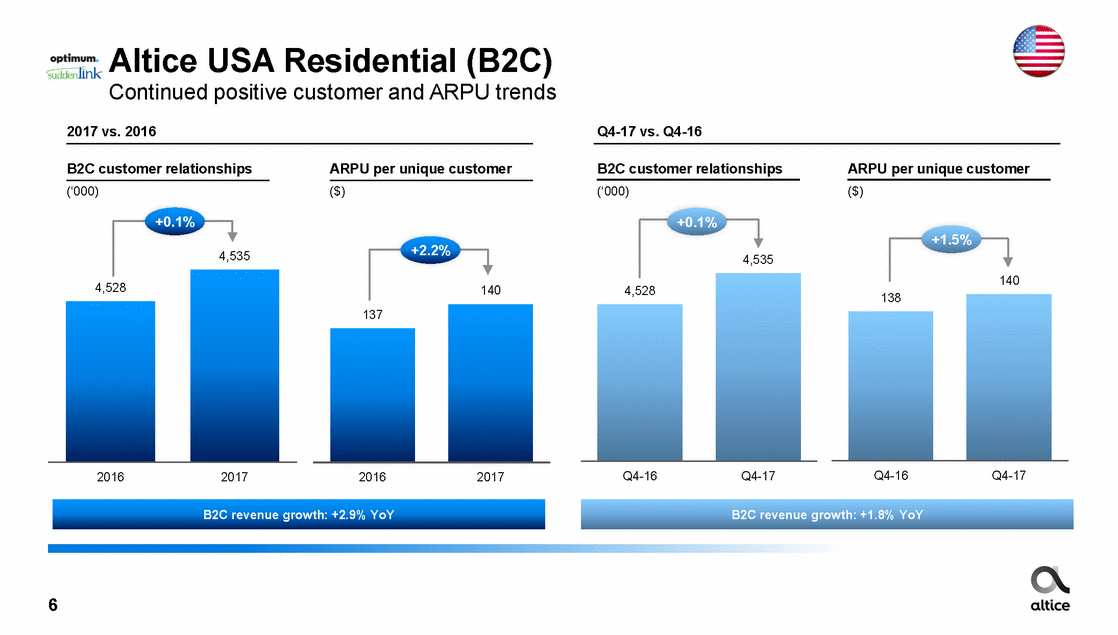
Altice USA Residential Strong underlying RGU trends B2C pay TV net adds (B2C) B2C broadband net adds ('000) ('000) Q4-16 Q1-17 Q2-17 Q3-17 Q4-17 40 36 25 16 2 (21) (25) (33) (35) (37) Q4-16 Q1-17 Q2-17 Q3-17 Q4-17 7 • Altice One entertainment platform to support growth: • All in one box including TV, internet, WiFi, integrated apps and voice-activated remote control • Full commercial launch at Optimum in Q1 2018 and at Suddenlink in Q2 / Q3 2018 • Streamlined Suddenlink bundle offers, introduced more localized pricing and added back Viacom content by the end of 2017 • Continuous broadband network upgrades supporting more reliable and faster broadband speed services
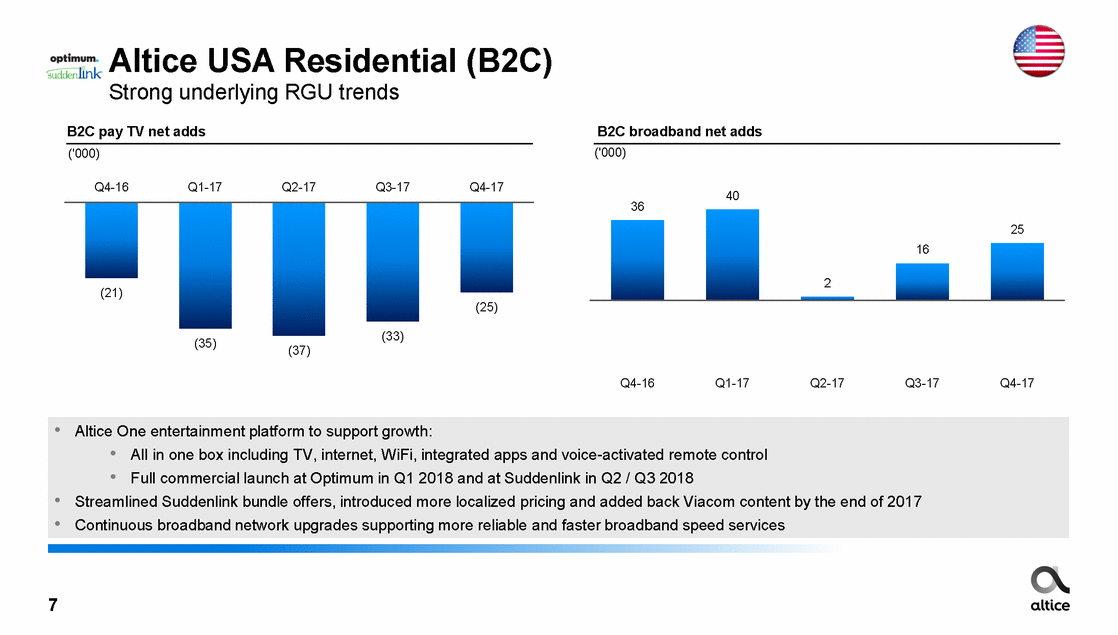
Altice USA Business Strong growth in SMB revenue Altice USA Business Services revenue growth Services (B2B) B2B highlights ($m) • SMB revenue growth +7.5% in FY 2017 (+6.0% in Q4-17) +5.5% • SMB c.63% of total B2B revenue 1,299 • Optimum 263k SMB customers 1,231 • Suddenlink 109k SMB customers 474 Enterprise & Carrier 464 +5.1% • Enterprise & Carrier revenue growth +2.3% in FY 2017 (+3.5% in Q4-17) 331 121 209 824 SMB 315 117 197 767 • Enterprise & Carrier c.37% of total B2B revenue • Lightpath c.76% of Enterprise & Carrier revenue 2016 2017 Q4-16 Q4-17 8
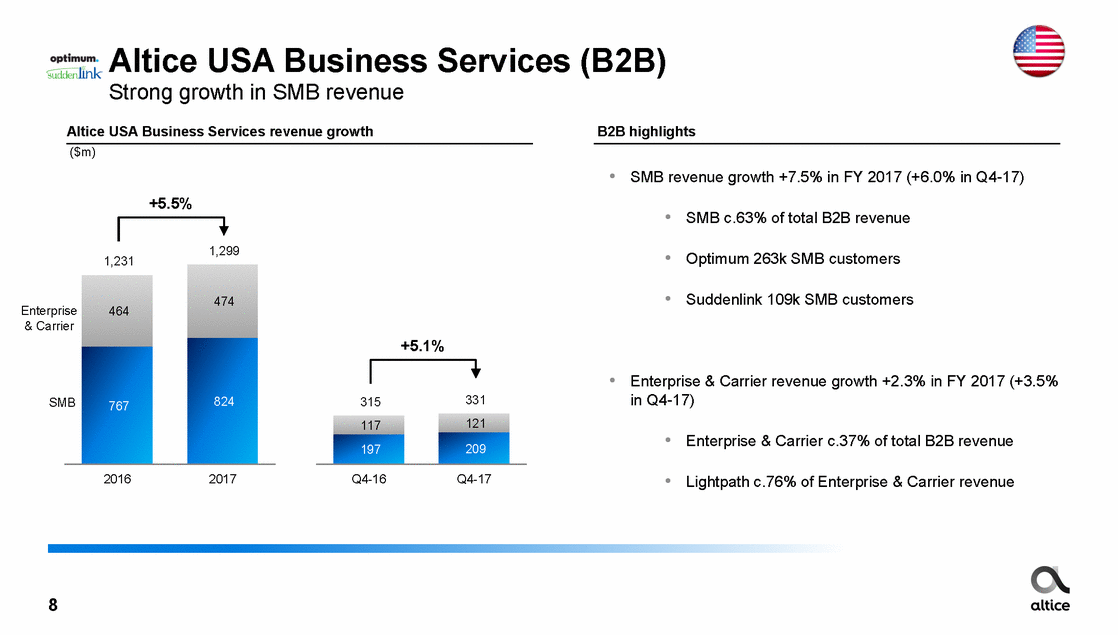
Altice USA Advertising Well positioned for growth in 2018 Altice USA Advertising revenue growth 2017 accomplishments ($m) • Acquired Audience Partners and Place Media to enable multiscreen addressable and national targeted advertising capabilities: +3.8% • Reach all US internet households with targeted digital advertising and 100m+ TV households with targeted video advertising 392 377 +9.9% • Announced the formation of a new New York DMA Interconnect that will reach 6.2 million households 122 111 • Reorganized our internal and customer-facing marketing capabilities into a single unit • Strong advertising revenue and ratings at News12 2016 2017 Q4-16 Q4-17 9
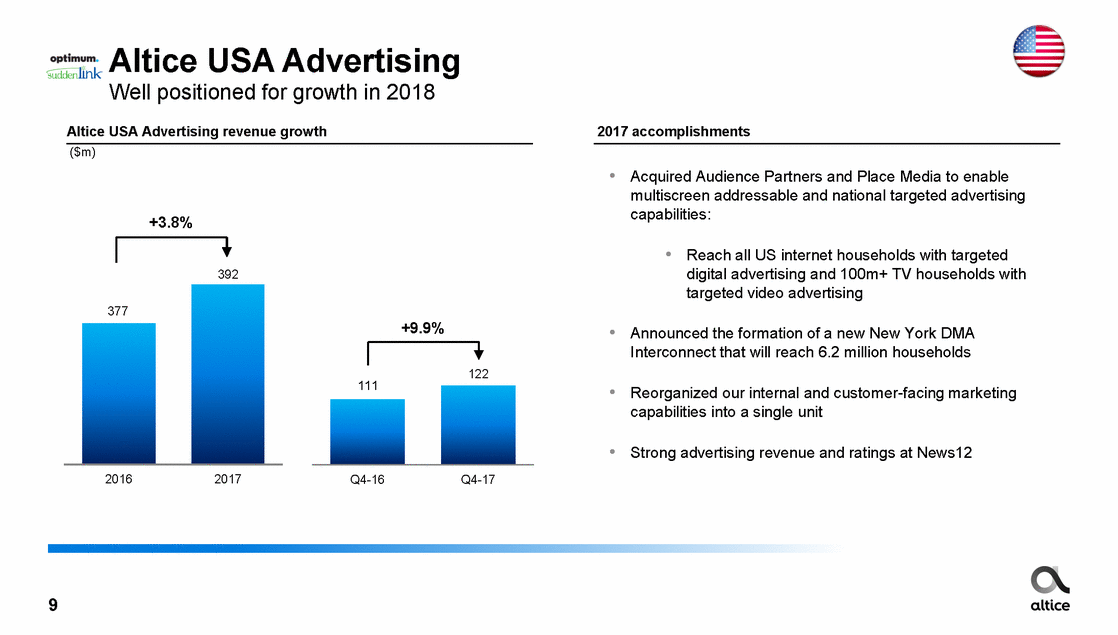
Altice USA Broadband Speed Availability Meeting customer demand for higher broadband speeds following network upgrades % of Homes Passed by available speed (equal to or greater than threshold shown) 1 Gbps: 16% 23% 29% 400 Mbps 16% 23% 86% 300 Mbps 16% 83% 89% 100 Mbps 96% 96% 96% Dec-15 Dec-16 Dec-17 10
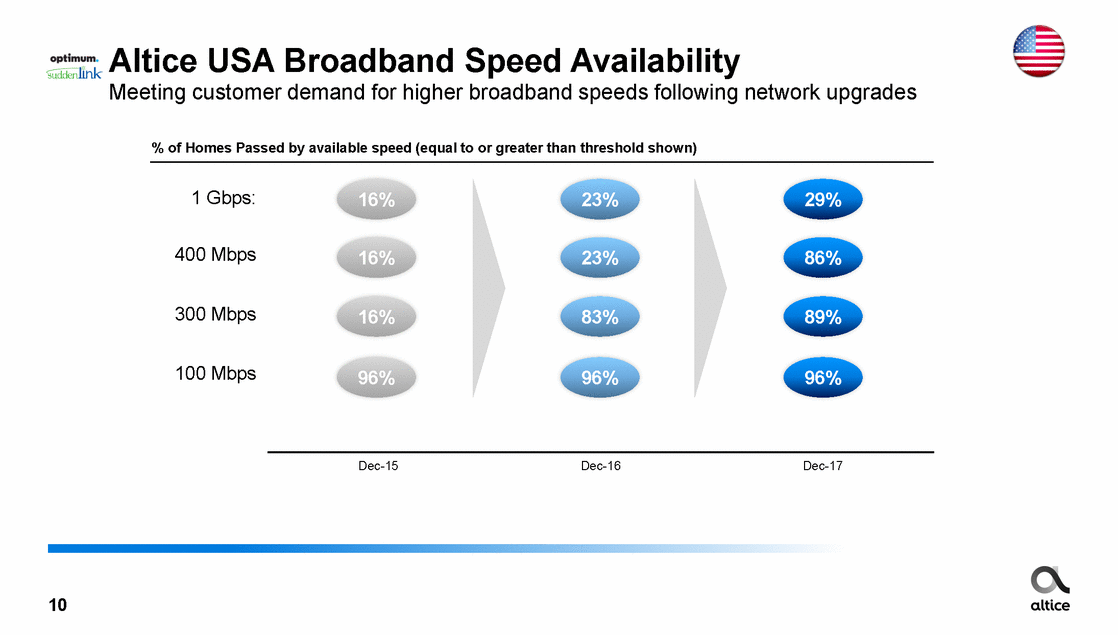
Altice USA Growth Investment in Innovative Services Enhancements to video product and network upgrades for next-generation services “The Grand Central of Entertainment” FTTH rollout Full MVNO agreement Core network development in 2018 Commercial launch by 2019 Acceleration of build planned in 2018 First FTTH commercialization in 2018 11
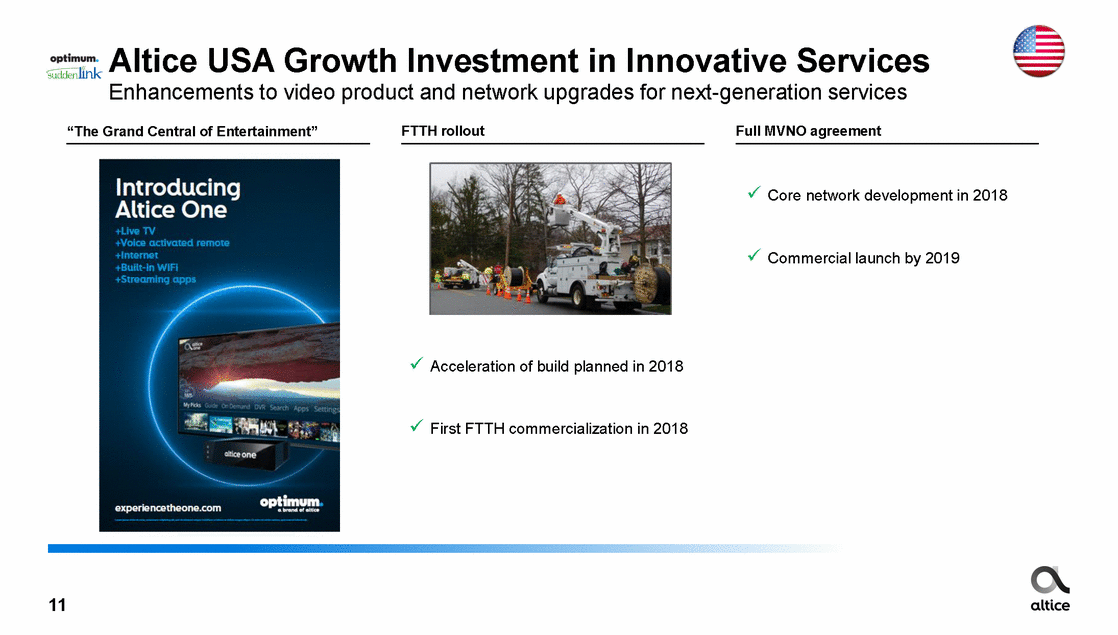
Altice USA Margin Progression Substantially improved margins and cash flow Altice USA Adj. EBITDA margin 1 (%) 44.1% Improved margins 42.9% 40.3% 37.1% 32.1% 31.8% Dynamic and simplified organization 32.3% 34.5% 29.6% 26.5% 17.3% 18.5% Re-investments 14.5% 13.5% 10.7% 10.6% 10.6% 9.6% 2015 2016 2017 Q4-15 Q4-16 Q4-17 Capex % of sales Operating free cash flow margin (1) Based on cash capex. Adjusted EBITDA and Adjusted EBITDA less cash capex (Operating free cash flow ) are non GAAP-measures. For a reconciliation of these non-GAAP measures to net income (loss), please see the Q4-17 Altice USA earnings release posted to the Altice USA website 12
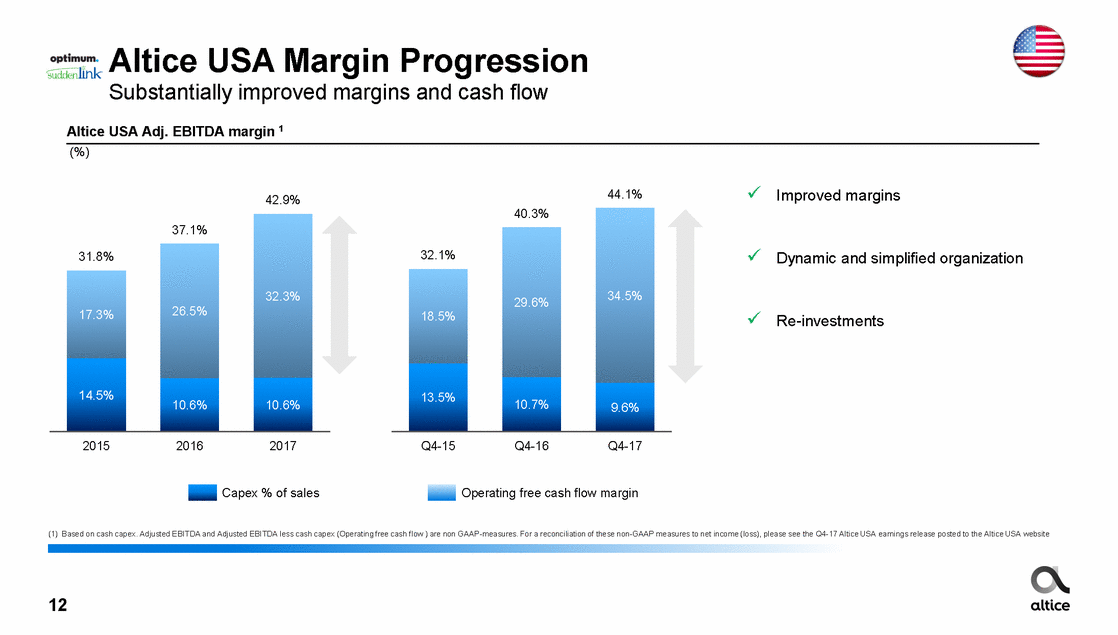
Altice USA Capex Profile Significant investment in infrastructure and new customer premise equipment Altice USA cash capex (pro forma 1) Major capital projects for 2017 to continue into 2018 ($m) • Increase in network infrastructure capex related to commencing fiber (FTTH) rollout 991 956 • Increase in CPE capex related to rollout of Altice One 142 Business Services 140 • Mobile MVNO network rollout commencing in 2018 188 Support and Other 197 Network Infrastructure 354 318 Customer Premise Equipment 301 307 2016 2017 (1) Capex for 2016 period is pro forma defined as results of Altice USA as if the Cablevision (Optimum) acquisition had occurred on January 1, 2016. 13
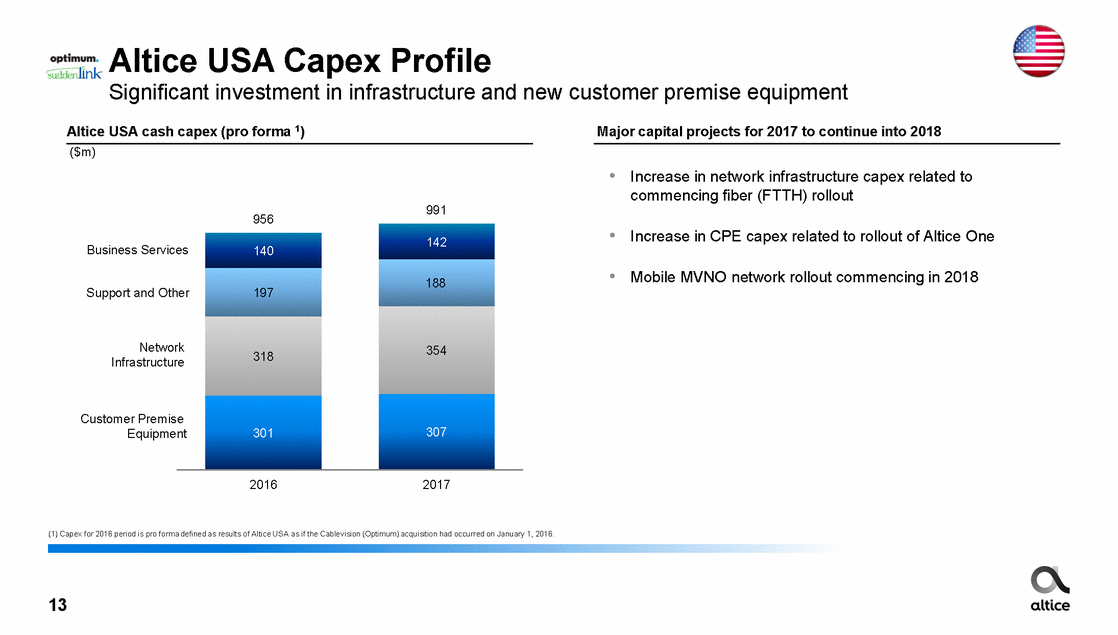
Altice USA Free Cash Flow Generation Strong FCF generation further supported by tax reform 2017 Free Cash Flow (FCF) and net change in cash bridge 2017 dividends and other cash items ($m) • Other operating cash flows includes $138m of cash restructuring costs Other investing activities includes M&A Financing activities includes $919m of cash dividend payments and $349m of IPO proceeds used to repay debt 4,006 • • 3,014 (991) Tax assets and positive tax reform impact 1,010 (1,765) (29) • (210) Tax assets support cash flow growth • NOLs $2.7bn as of the end of 2017 • Noncash deferred tax benefit of $2.3bn for reduction in federal income tax from 35% to 21% Altice USA is now not expected to be a significant cash taxpayer until 2020 (from 2019) • New lower rate in 2018 reduces cash taxes in 2020 and thereafter (141) (1,099)(230) Adjusted EBITDA Cash Capex Operating Free Cash Flow Cash Interest Cash Taxes Other operating cash flows Free Cash Flow Other FinancingNet investing activities change in • activities cash 14
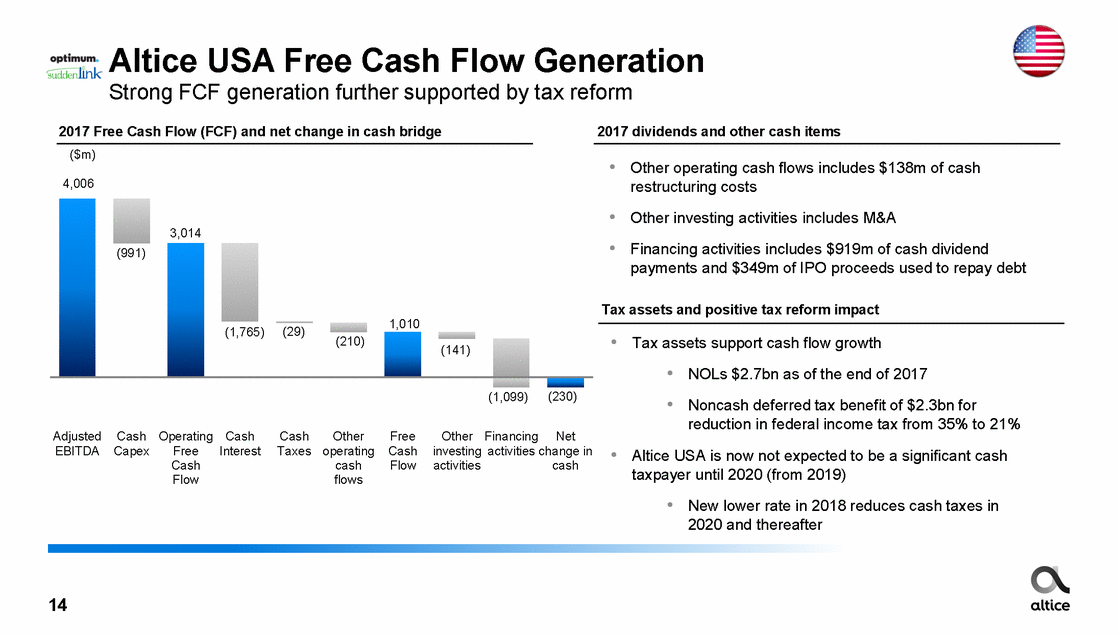
1 Altice USA Leverage, Maturity and Liquidity Analysis Rapid de-leveraging with strong liquidity position Long-dated maturity profile & strong liquidity position Rapid de-leveraging supporting shareholder returns Net Debt / LTM EBITDA • • WAL life of 6.3 years and WACD of 6.2% 7.7x No material maturities at Suddenlink until 2021, and near-term maturities at Optimum covered by a $2.3bn revolving credit facility 6.8x 5.6x1 4.5x to 5.0x 5.5x1 5.3x $1.5bn dividend • Available liquidity of $2.3bn $1.5bn dividend • $0.3bn cash • $2.0bn undrawn RCF 5.1x 5.1x • Commitment to de-leverage shortly to 4.5-5.0x target Q2-16 Q4-17 Q4-15 Q4-17 Q4-17 Target Altice USA (1) Adjusted for $1.5bn special cash dividend and pro-forma for refinancing of $750m 7.750% Senior Notes due 2018 and $300m 7.875% Senior Notes due 2018 at Optimum and new organization Note: For new organization (integration Altice Technical Services US) there is no material impact on net debt and LTM EBITDA: consolidated US leverage remains at 5.5x and liquidity increase by circa $57m 15
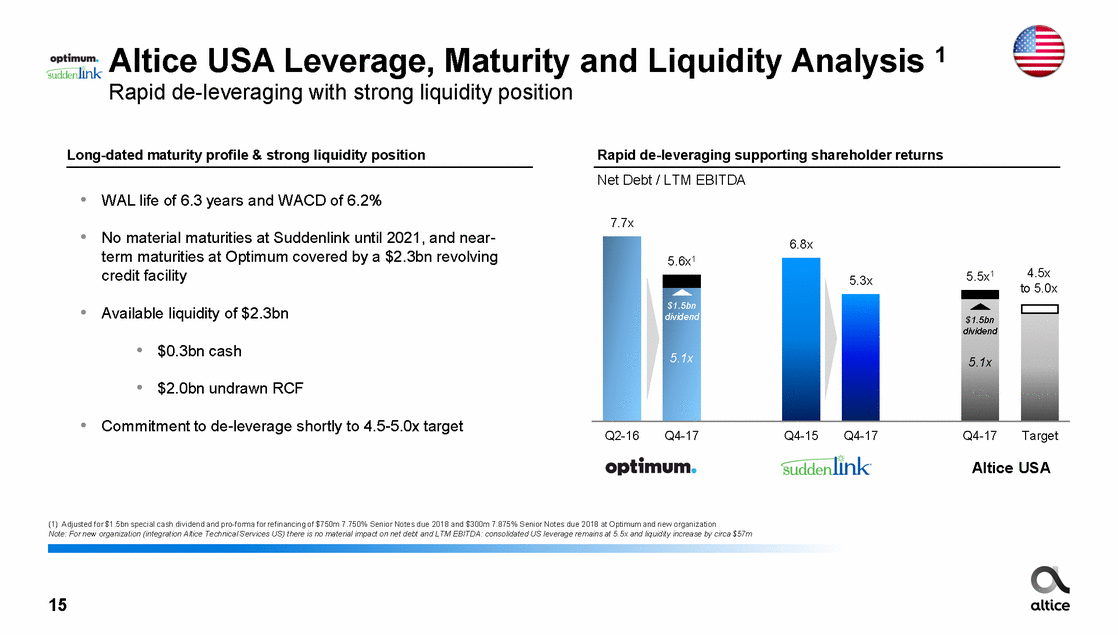
1 Altice USA Debt Maturity Profile Long-dated maturities following pro-active refinancing activity Altice USA maturity profile ($bn) 0.6 0.6 1.6 2.8 0.7 3.0 0.8 12.5 2018 2019 2020 2021 2022 2023 2024 >22002255 (1) Adjusted for $1.5bn special cash dividend and pro-forma for refinancing of $750m 7.750% Senior Notes due 2018 and $300m 7.875% Senior Notes due 2018 at Optimum and new organization Note: Maturity profile excluding leases/other debt (c.$33m), includes RCF drawn of $500m for Optimum shown at maturity date 16
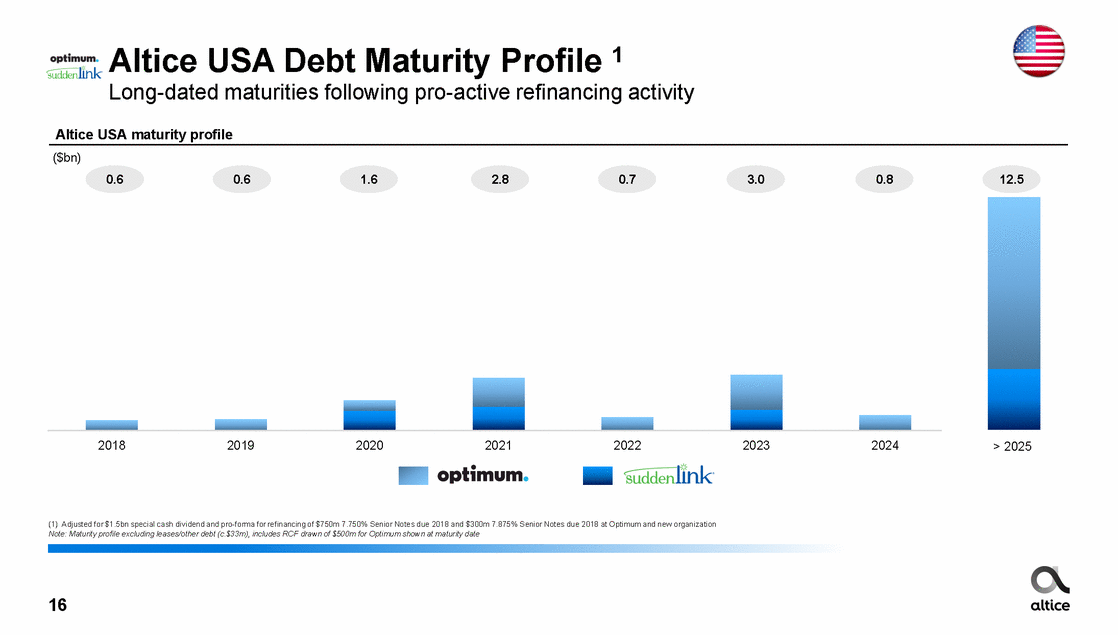
Altice USA FY 2018 and Medium-Term Outlook Continued revenue growth, margin expansion and cash flow growth 2018 Revenue Growth (YOY) 2018 Annual Capex Altice USA reiterates plan to expand its Adjusted EBITDA and cash flow margins over the medium-to long-term 17 • ~$1.3bn • c.2.5-3.0%
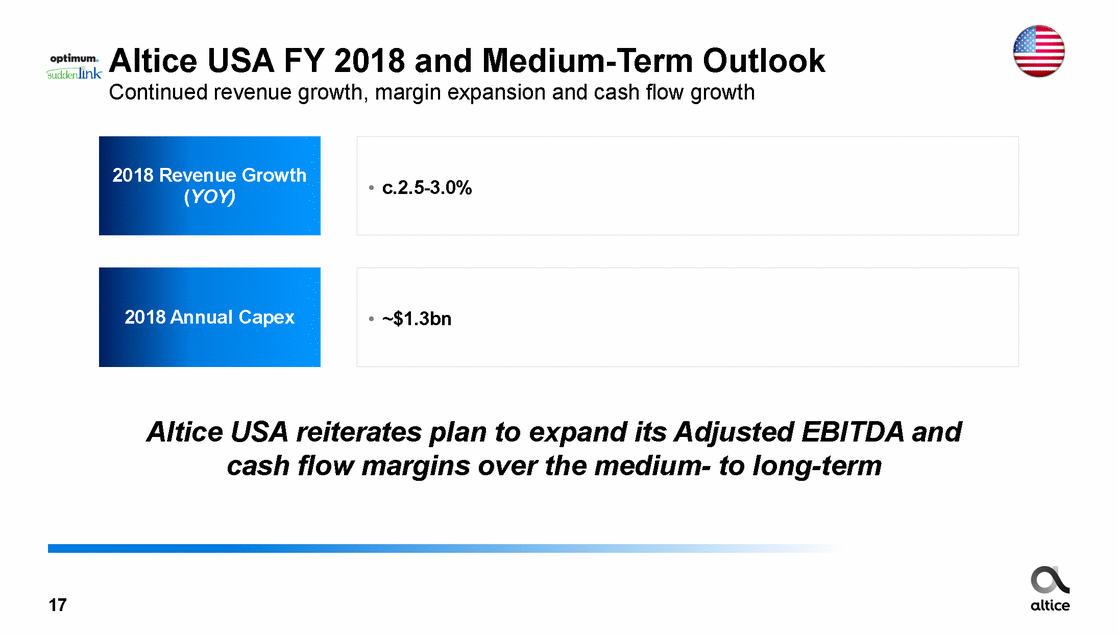
Q&A 18 altke

Appendix 19

Altice USA, Inc. Numbers Pro forma US GAAP financials (USD) 1 (1) Revenue and capex are prepared in accordance with U.S. GAAP. Adjusted EBITDA is a non-GAAP measure. For a reconciliation of Adjusted EBITDA to net income, please see the Q4-17 Altice USA earnings release posted to the Altice USA website (2) Based on cash capex. Adjusted EBITDA and Adjusted EBITDA less cash capex (OpFCF) are non GAAP-measures. For a reconciliation of these non-GAAP measures to net income (loss), please see the Q4-17 Altice USA earnings release posted to the Altice USA website 20 ($m)FY-16FY-17Growth YoY Q4-16Q4-17Growth YoY Optimum6,466 Suddenlink2,573 Eliminations-Total Revenue 29,039 YoY growth (%)3.6% Optimum2,197 Suddenlink1,155 Adjusted EBITDA3,352 Margin (%)37.1% Optimum628 Suddenlink327 Capital expenditures956 Capex to sales (%)10.6% Optimum1,569 Suddenlink828 OpFCF 22,396 Margin (%)26.5% 6,665 2,665 (3) 9,327 3.2% 2,751 1,255 4,006 42.9% 711 280 991 10.6% 2,040 975 3,014 32.3% 3.1% 3.6% 3.2% 25.2% 8.6% 19.5% 13.2% (14.4%) 3.7% 30.0% 17.8% 25.8% 1,645 660 - 2,306 5.1% 621 309 930 40.3% 147 100 248 10.7% 474 208 682 29.6% 1,691 676 (2) 2,365 2.6% 731 312 1,043 44.1% 161 67 228 9.6% 570 245 815 34.5% 2.8% 2.4% 2.6% 17.8% 1.1% 12.2% 9.4% (33.4%) (8.0%) 20.4% 17.8% 19.6%
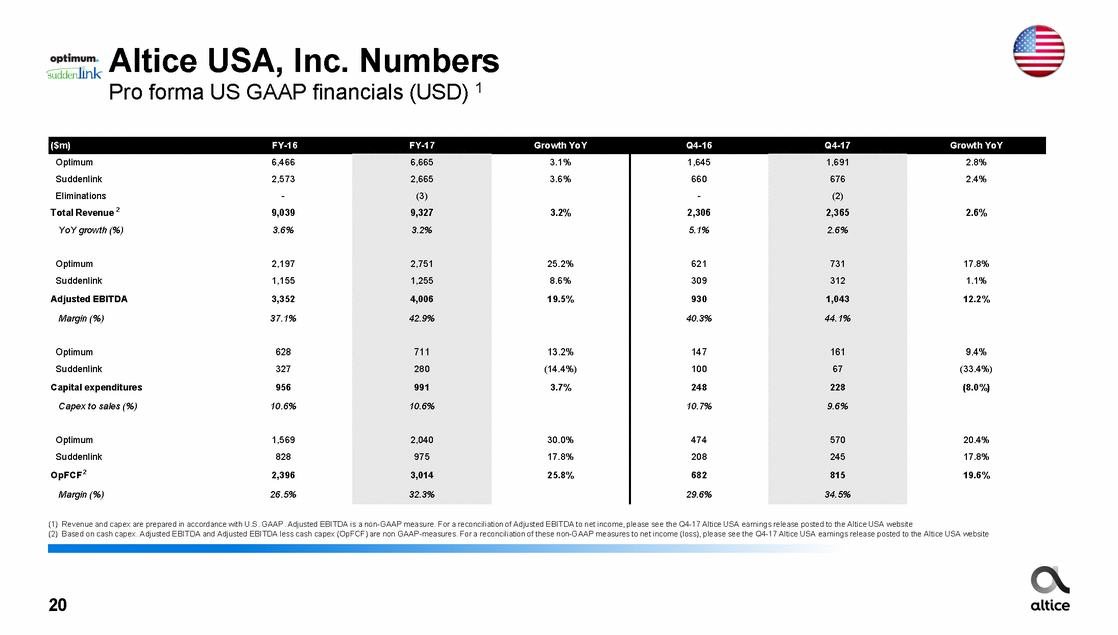
1 Altice USA Debt Capital Structure Per Q4 2017 as adjusted for Altice USA special cash dividend Cablevision (Optimum) 1 Cequel (Suddenlink) (1) Adjusted for $1.5bn special cash dividend and pro-forma for refinancing of $750m 7.750% Senior Notes due 2018 and $300m 7.875% Senior Notes due 2018 at Optimum and new organization (2) Excluding management fees (3) Suddenlink RCF $350m undrawn minus $14m LOCs. Optimum RCF of $2,300m minus $116m LOCs and $500m drawn (PF for additional $50m drawing for dividend) Note: For new organization (integration Altice Technical Services US) there is no material impact on net debt and LTM EBITDA: consolidated US leverage remains at 5.5x and liquidity increase by circa $57m 21 Cequel (Suddenlink) silo Cablevision (Optimum) silo Altice USA (Consolidated) 1 Gross Debt $22,516m Net Debt $22,243m LTM Adj. EBITDA GAAP 2 $4,036 Net Leverage 5.5x Undrawn RCF (Consolidated) 3 $2,020m 100% 100% Gross Debt $6,786m Net Debt $6,704m LTM Adj. EBITDA GAAP 2 $1,265m Net Leverage 5.3x Undrawn RCF 3 $336m Gross Debt $15,730m Net Debt $15,544m LTM Adj. EBITDA GAAP 2 $2,771m Net Leverage 5.6 x Undrawn RCF 3 $1,684m
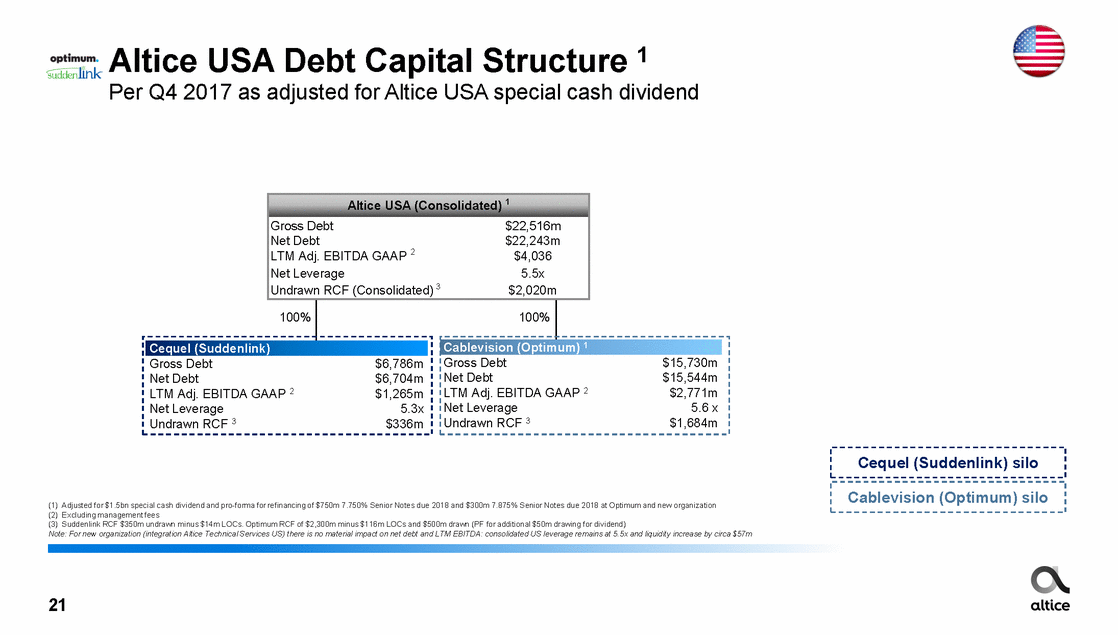
Altice USA Separation Overview Altice USA to be structurally separated from Altice NV; both controlled by Patrick Drahi effective following completion of the separation (both approved by independent members of Altice USA Board) (1) The distribution will exclude shares indirectly owned by Altice NV through Neptune Holding US LP (3.4% assuming reference share price of $21.23 as of 31-12-2017 for Altice USA) (2) Next owned by Patrick Drahi (3) Altice NV’s ownership of ATS US transferred at a nominal consideration 22 Transaction structure Spin-off of Altice NV’s 67.2% interest in Altice USA through a distribution in kind to Altice NV shareholders 1 Altice USA $1.5bn special cash dividend paid prior to separation and authorized share repurchase program of $2bn Next 2, together with parties in concert with Next, remains controlling shareholder in both Altice NV and Altice USA with commitment to long-term ownership Perimeters Altice USA spin-off from Altice NV, including transfer of Altice Technical Services (ATS) US 3 Timing Q2 2018 expected completion Approvals Subject to Altice NV shareholder approval Form S-1 filed with the SEC and offering prospectus to be approved by the AFM
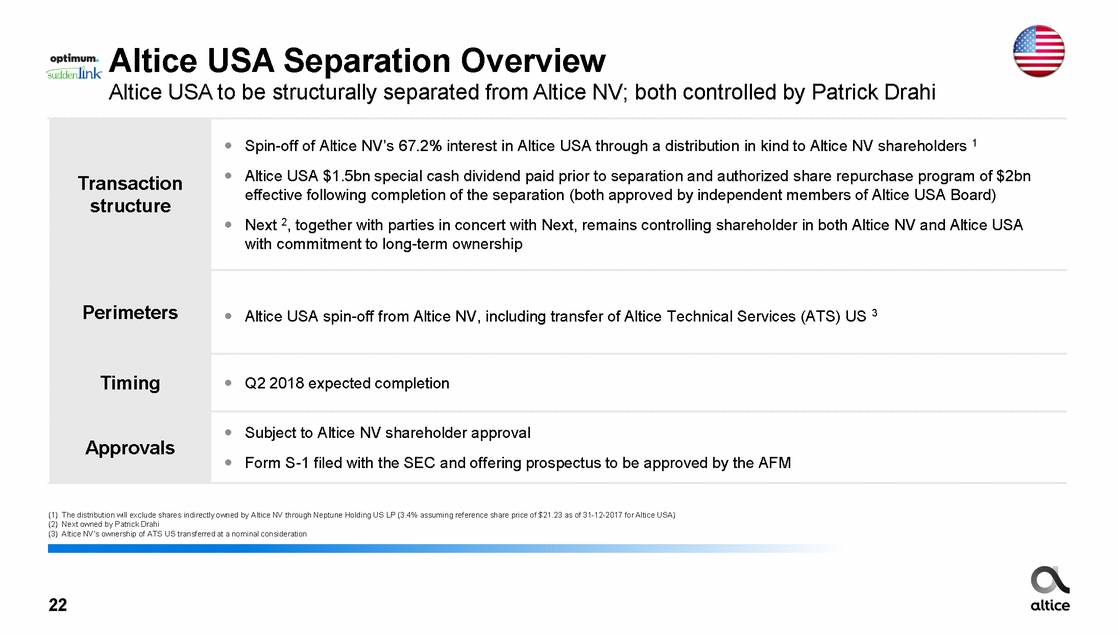
Altice USA has filed a registration statement with the Securities and Exchange Commission (SEC) for the offering to which this communication relates. You should read the preliminary prospectus in that registration statement and other documents Altice USA has filed with the SEC for more complete information about Altice USA. You may get these documents for free by visiting EDGAR on the SEC website at www.sec.gov. Alternatively, you may also request a copy of the current preliminary prospectus, at no cost, by mail to Lisa Anselmo, Altice USA, Inc., 1 Court Square West, Long Island City, NY 11101 USA.